summarise information from the charts
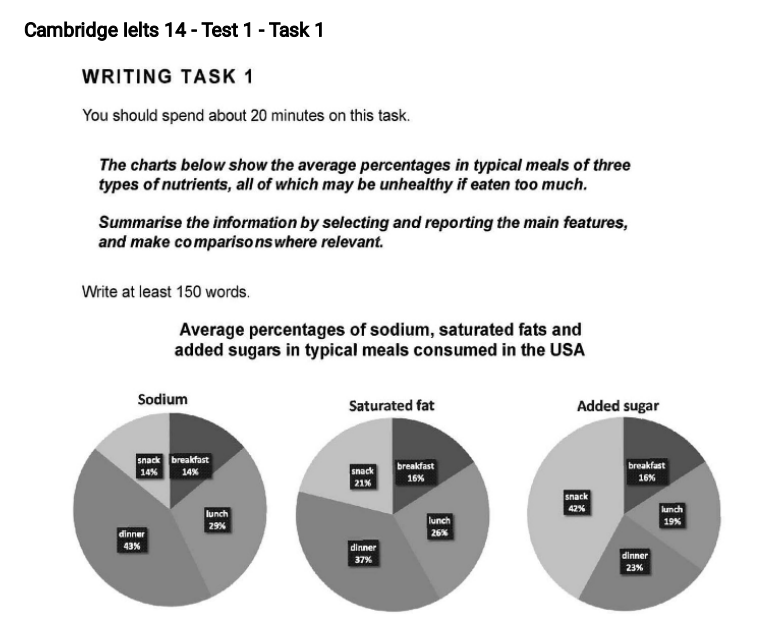
The three circular charts illustrated the proportion of three types of nutrients in breakfast, lunch, dinner and snacks. The data was collected from typical meals in the USA. Overall, the percentages of sodium and saturated fat were seen to be the largest in the dinner meal which were 43% and 37% respectively, while added sugar made up the largest proportion in snacks (42%)
To be more detailed, the proportions of sodium and saturated fat were quite similar. The second largest proportions of these two types of nutrients were in lunch which were 29% of sodium and 26% of saturated fat, while the proportions in breakfast were the smallest which were 14% of sodium and 16% of saturated fat.
However, the chart of added sugar showed a different pattern. It can be told from the chart that dinner contained the second largest amount of added sugar. Meanwhile, the percentage of added sugar in breakfast and lunch did not have much difference: 16% of sugar in breakfast and 19% of sugar in lunch resulted in just a 3% gap.
Thank you for reviewing!

cambridgeielts14w.png
