TASK 1.
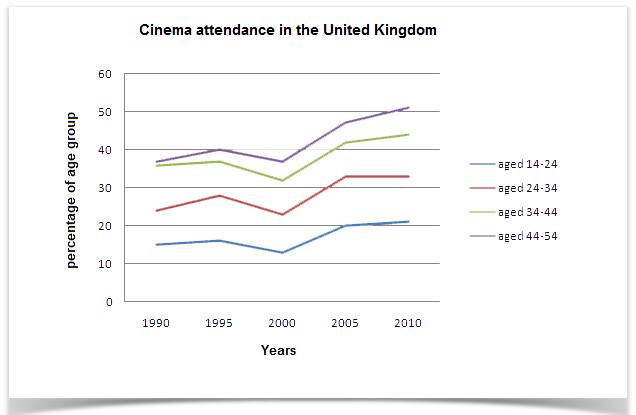
The line graph below gives information on cinema attendance in the UK.
Answer:
A breakdown of the proportion of four age groups who came to the movie theatre in United Kingdom from 1990 to 2010 as a projected year, a two-decade period, was revealed in the line graph. Overall, it can be seen that all age categories experienced a significant increase from the beginning to the last year, but in the middle of period, there were a slight decrease for all age types.
According to the data, in 1990, the two age groups such as aged 44-54 and 34-44 stood at the highest rates; 37%, 36%, respectively, while other classes (both aged 24-34 and 14-24) started from 24 and 15%. Then, in 1995 saw an slight rise about 1-3 percent for all categories. Unfortunately, in next five years, approximately all age types except the oldest ages fell steadily over the rate of the beginning.
By 2000, it had showed that the highest figure of visiting to the cinema was still held by the oldest group, whereas the lowest stage was displayed by aged 14-24; 12%. Furthermore, in the middle of period, all age types of movie viewers inclined dramatically about 10% and in 2010, nearly four categories did not witness increasing significantly .

12592255_10201329162.jpg
