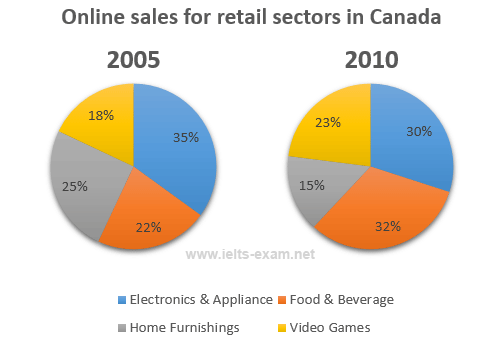
The pie charts compare the proportion of certain selected goods sale online for retail sector in Canada in 2005 and 2010. overall, it can be seen that the greatest change was in the proportion of online sales on food and beverage.
By 2005, food and beverage online sales had reached more than a fifth of all the online sales while it rose dramatically to 32% in 2010. At 35%, electronics and appliance online sales was the highest online sales, but this fell slightly to less than a third ten years later.
By contrast, a minority of the online sales in 2005 was video game's sales. It stood at only 18% while it experienced a significant increase up to more than a fifth of all online sales in 2010. On the other hand, the sales of home furnishings had reached to a quarter of the online sales, but it dropped dramatically at less than a fifth.

The pie charts
