Summarise the information by selecting and reporting the main features and make comparisons where relevant.
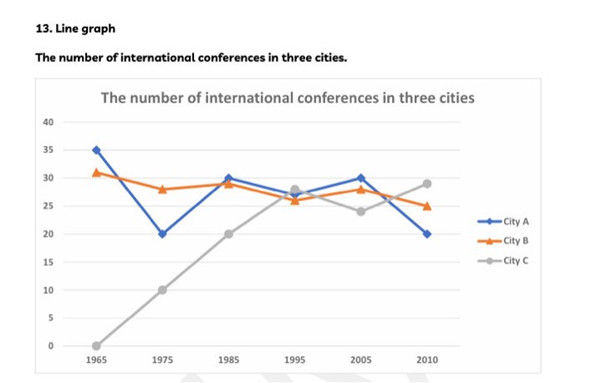
The line graph compares how many overseas conferences held in City A, City B and City C from 1965 to 2010.
Overall, while City A's figure for international discussions fluctuated and City B's fell slightly, that of City C increased considerably. It is also noticeable that City C had the lowest position among the three at the beginning but the highest number in the final year of the period shown.
In 1965, the number of worldwide conferences in City A and City B was nearly 35 and 30 respectively, which was by far higher than the figure for City C, at around 0. Over the next 30 years, City A witnessed a significant fluctuation, ending up at over 25 in 1995, while City B's number dropped slightly by 5. By contrast, City C rocketed and surpassed the two to reach the number of nearly 30 in the same year.
In 1995, the numbers of overseas meetings of three cities shown in the graph were roughly the same, which was between 25 and under 30. By 2010, there was a gradual increase in City A's number, before dropping rapidly to 20. Meanwhile, City C's figure declined between 1995 and early 2005, but later rose to peak at around 30 by the end of the period. During the same period, City C made up a negligible movement.
Could you give me a band score?

linegraph.jpg
linegraph.jpg
