Please ignore the odd structure because of the IELTS marking scheme.
Focusing in grammar and sentence patterns is fine. Thank you!
Below is the essay:
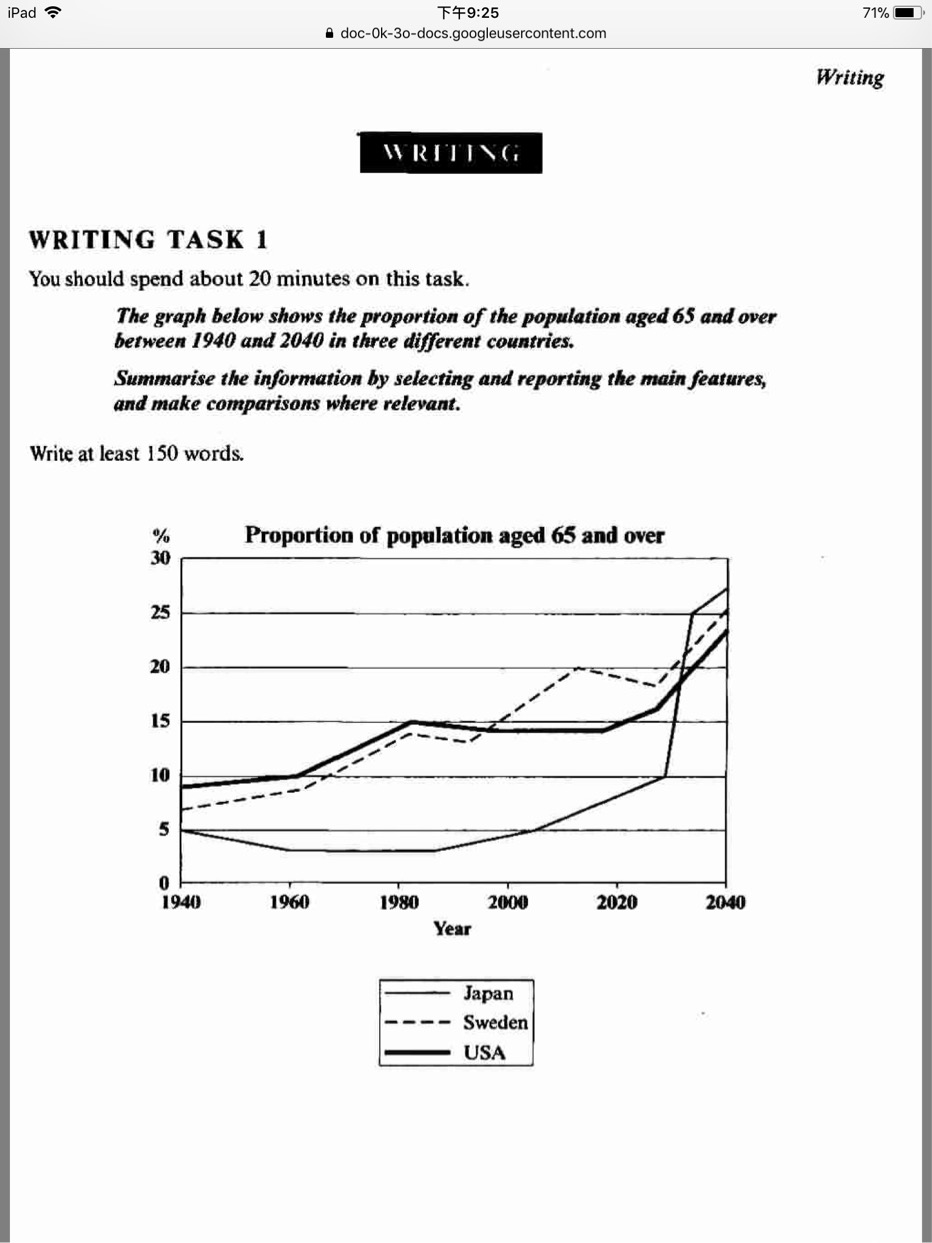
The line graph illustrates the percentage of people aged 65 and above in three countries (Japan, Sweden and USA) from 1940 to 2040.
Overall, the consumption of all countries rose over the period given. From the period started, the highest proportion of old people was in United States, which was replaced by Sweden between later 1990s and 2030, and following that Japan became the popular spread.
The percentage of old American started at approximately 9% in 1940, then the figure fluctuated and increase to 28% in 2040. Likewise, in the first year, there were 7% of population aged 65 and over in Sweden. It climbed up at just over 25% in the final year after it experienced years of fluctuation.
With regards to the proportion of elderly in Japan, it began at exactly 5% and went up dramatically to reach a high of 27% in the last year.
Focusing in grammar and sentence patterns is fine. Thank you!
Below is the essay:
proportion of elder population in some three countries
The line graph illustrates the percentage of people aged 65 and above in three countries (Japan, Sweden and USA) from 1940 to 2040.
Overall, the consumption of all countries rose over the period given. From the period started, the highest proportion of old people was in United States, which was replaced by Sweden between later 1990s and 2030, and following that Japan became the popular spread.
The percentage of old American started at approximately 9% in 1940, then the figure fluctuated and increase to 28% in 2040. Likewise, in the first year, there were 7% of population aged 65 and over in Sweden. It climbed up at just over 25% in the final year after it experienced years of fluctuation.
With regards to the proportion of elderly in Japan, it began at exactly 5% and went up dramatically to reach a high of 27% in the last year.

Graph market
