Unanswered [0]
  

Home / Writing Feedback   % width   Posts: 4


Passenger activity of Toronto metro system


nguunguu90 1 / 1  
Jul 23, 2020   #1

Toronto metro system graph


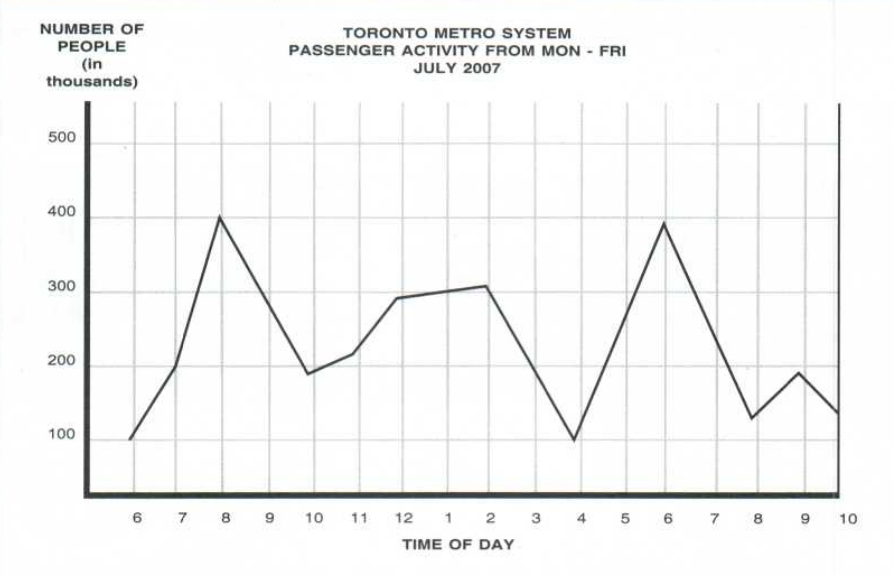
The line graph shows the passenger activity of Toronto metro system in different period of the daytime.
Overall, two periods illustrate the same trend of using train: from 7 - 10h in the morning and from 4 - 8h in the afternoon. Additionally, the use of the train system was lowest at 6 am and 4 pm.

In the morning, starting at 6 am, 100,000 people were commuting by train. This figure increased gradually after that and reached a peak of 400,000 at 8 am. The number of train travelers saw a dramatic fall to half at 10 pm, then rose slowly to 300 thousand passengers and mostly stayed the same during the next two hours.

At 4h in the afternoon, 400 thousand people were using the train, the lowest point of all. By contrast, in the next two hours, the graph witnessed a sharp increase in the demand for train commuting, again reaching the highest point before experienced a gradual decrease to nearly 150,000. The amount continued to fluctuate between 150,000 and 200,000 people after 8 pm.

  • BiuTest1.png


jhhh11 14 / 30  
Jul 23, 2020   #2
Hi! Here are some feedback:

First of all, you should include the question so that we can see if you have paraphrase it or not.

- " different period of the daytime."
--> The statistics were recorded until 10PM, so I don't think that you should use the word "daytime".

- "... same trend of using train: from 7 - 10h in the morning ..."
--> You should say that the top figures occur at 8am and 6pm. These are the "overall" data that you should mention.
Holt  Educational Consultant - / 15512  
Jul 23, 2020   #3
There is a discrepancy in your time description. The trains were used until 10 PM at night, not 8 PM. So you offered inaccurate information that would have affected the clarity and validity of your report. You would have given inaccurate data representation, causing your TA to be questionable.

In your second paragraph, you said that the travellers showed a decline at 10 PM but rose afterwards. That can't be right either. I mean, the commuting stopped at 10 PM. So how could there be a gradual rise in use? You really have a problematic analysis of the line graph here. This won't be good for your final score.
OP nguunguu90 1 / 1  
Jul 23, 2020   #4
Thank you for pointing out my mistakes. I'll rewrite it to make it better.


Home / Writing Feedback / Passenger activity of Toronto metro system
ⓘ Need Writing or Editing Help?
Fill out one of these forms for professional help:

Best Writing Service:
CustomPapers form ◳

Graduate Writing / Editing:
GraduateWriter form ◳

Excellence in Editing:
Rose Editing ◳

AI-Paper Rewriting:
Robot Rewrite ◳