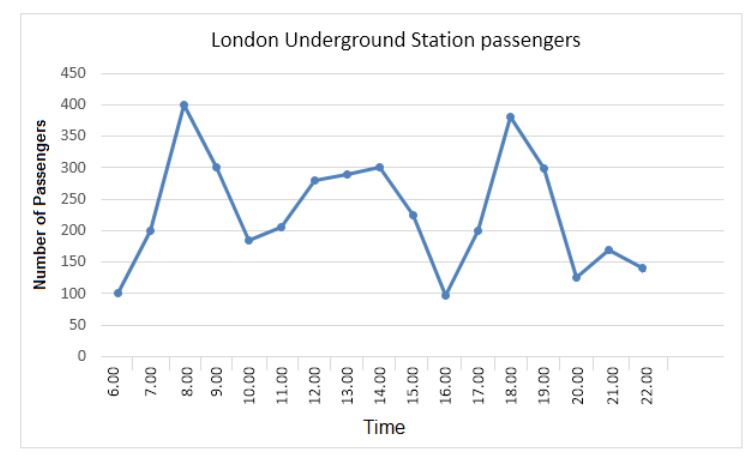
The graph shows Underground Station passenger numbers in London.
Summarise the information by selecting and reporting the main features, and make comparisons where relevant.
My answer:
The graphs shows the number of passengers in the London Underground Station per hour, from 6 a.m to 10 p.m. It is easy to see that there is quite e great variability of passengers' flows.
During the day, there are two peak of affluency, at 8 a.m and at 6 p.m, where the number of passengers is around 400 per hour. On the opposite side, it is possible to identify the lowest levels, with only 100 passengers, at the beginning of the underground service at 6 a.m and at 4 p.m. Moreover, looking at central hours of the day, from 9 a.m to 3 p.m, the numbers of passenger fluctuates between 200 and 300. Finally in the evening, after 8 p.m, flows are stable between 100 and 150.
To sum up, the number of passengers at the London Underground Station varies, on average, during the opening hours, from 100 to 400, with some peakes related to office-hours.

IELTS_writing_task_2.jpg
