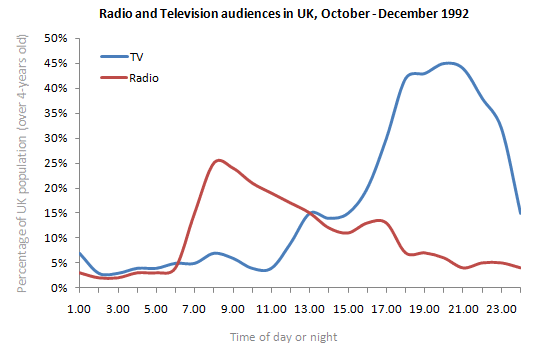
The graph below shows radio and television audiences of United Kingdom throughout the day in the year 1992.
The diagram provides information of the people in the UK above the age of 4, who chose either listen to the radio or watch television throughout the day in the year of 1992.
According to the chart, the radio audiences had raised sharply from 6 to about 8 AM, peaking at the percentage of 25. Although the number had increased a little at around 5 PM, the trend was downward for the rest of the day.
Unlike radio, the television line had come to its peak at around 8 PM. The number dropped dramatically from 10 to 12 at night. However, both radio and television had 15 per cent of audiences when it came close to 2 PM. From then, the television audiences leveled off til 8 PM.
By looking at the graph, there were much more UK audiences preferred watching TV rather than listening to radio. Throughout the day, TV was more popular in the UK.
-
Could anyone tell me is it necessary (or allowed) to write a conclusion in IELTS writing task 1?
Thank you for offering your help!
Naomi

twolinegraphs.png
