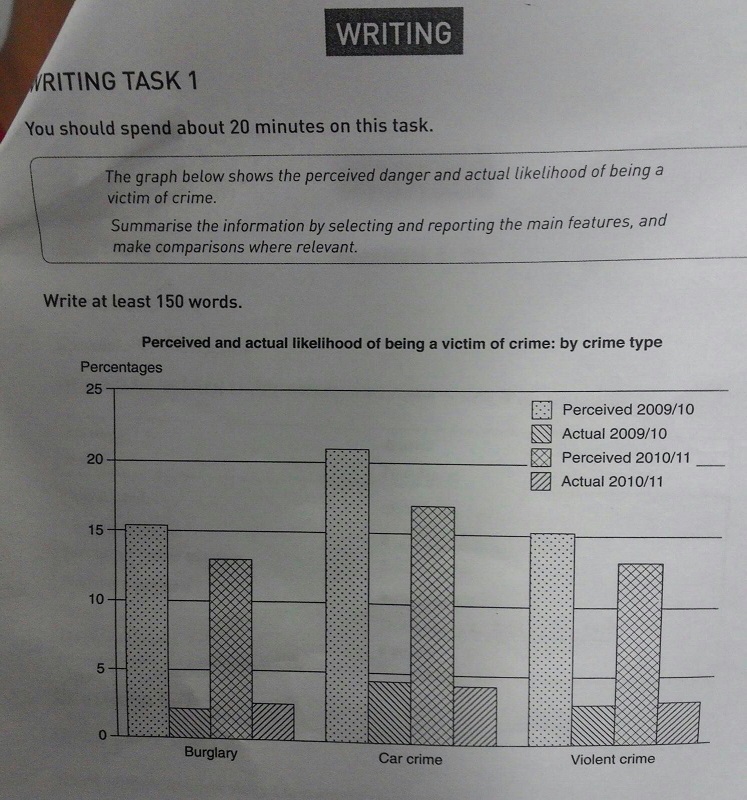
The bar chart gives a set of information about the perceived and actual likelihood of being a victim of crime indicated in varied-variables, quantified in percentages.
Overall, the perceived 2009/10 dominated in car crime. While, three others namely actual 2009/10; perceived 2010/11; and actual 2010/11, are rangked as the followers of the perceived 2009/10, it was a noticeable account in which the actual 2010/11 was the lowest one in numeral crimes.
As per data, car crime shown a dramatic increase in perceived 2009/10 around 6%. Indeed, it was clear information of the issue leveled out at 21% in car crime. Following that trend, the perceived 2010/11 is also relatively high in car crime. Correlated with that, other crimes such as violent crime tended to exactly be change in which the perceived 2009/2010 continued as the highest pattern in violent action. The perceived 2010/11 ready positioned as the second level after. The reverse of that condition, the actual of both 2010/11 and 2009/10 was the lowest trend in various crimes such as burglary, car crime, and violent crime.

IMG20160208WA0002..jpg
