Access to modern technology
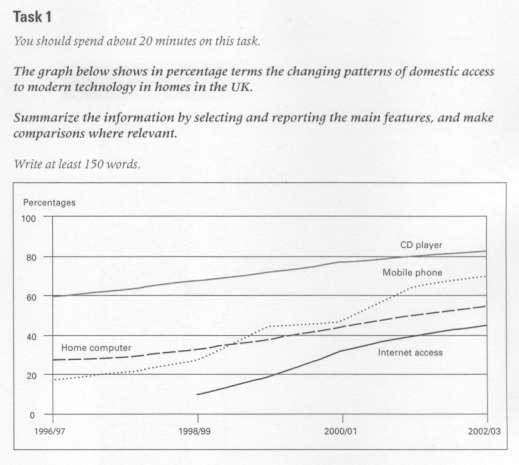
The graph below shows in percentage terms the changing patterns of domestic access to modern technology in homes in the UK.
SUMMARISE THE INFORMATION BY SELECTING AND REPORTING THE MAIN FEATURES AND MAKE COMPARISONS WHERE RELEVANT.
The line graph depicts the change in the usages in homes of latest devices in the UK namely CD player, cellphone, desktop PC and the Internet from 1996 to 2003.
As can be seen, the figure for all of the newest gadgets climbed sharply over the period shown. Moreover, CD player made up the biggest share while the least was the Internet.
In 1996/97, about 60% population of Britain used CD player and this figure was up to over 80% in the final year. Similarly, personal computer showed the same trend and doubled from around 25% to over 50% in 2002/03.
Besides, cellphone had the most significant increase which began at just under 20% then peaked at 70% despite some fluctuations during the the period. In 1998/99, the appearance of the Internet experienced an exponential growth in the pattern of residental access to this application. To be specific, access to the Internet held a share of 10% at the beginning and after that, skyrocketed to approximately 50% by the end of the period.
(173 words)

line graph
