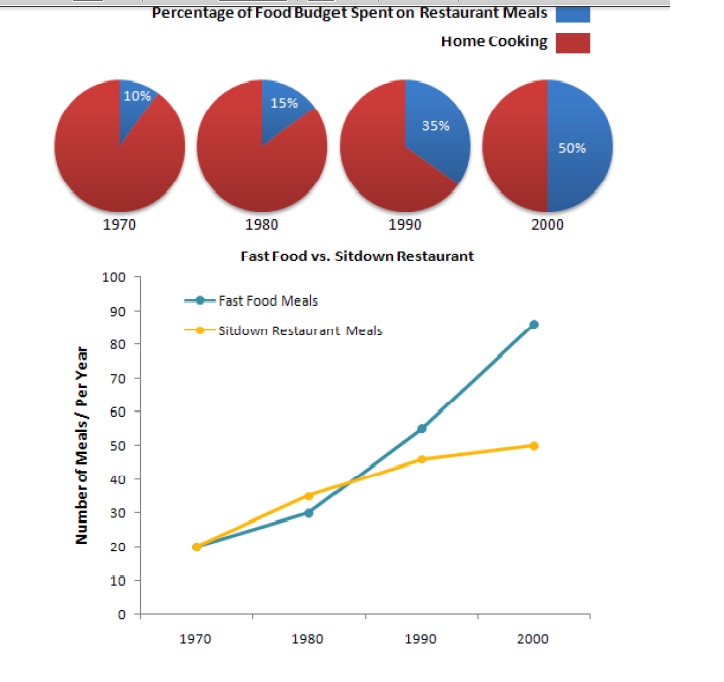
The pie charts tell about the proportion of meal the average of budget of relatives expended on cafeteria foods in distance of years; meanwhile, the line graph shows the numeral of foods in which sit-down cafe.
According to the data, in 1970, the percentage of home cooking became the higher position than the proposition of meal funds on the restaurant. Furthermore, the percentage of the food finances spent on the cafe increased 5% in 1980, and followed by the charts, the fraction of the nourishment spent on the bistro used to rise toward the end of the year. In the contras, the proportion of the home cooking used to plummet every 10-year while the percentage of the meal funds rocketed.
A more detailed looked at the line graph gives information about the numeral of meals which started from 1970-to-2000. Both of them had sameness when posited in the first year. In additional, the percentage of the sitting restaurant foods surged gradually to touch 30%, but the proportion of previous cafe meals peaked slowly to reach approximately 35%. Moreover, the number of fast meals soared; meanwhile, the numeral of the taking a seat declined progressively toward the last of the year.
In a nutshell, there were many people who preferred to sit in the restaurant more than the home cooking.

Need feedback
