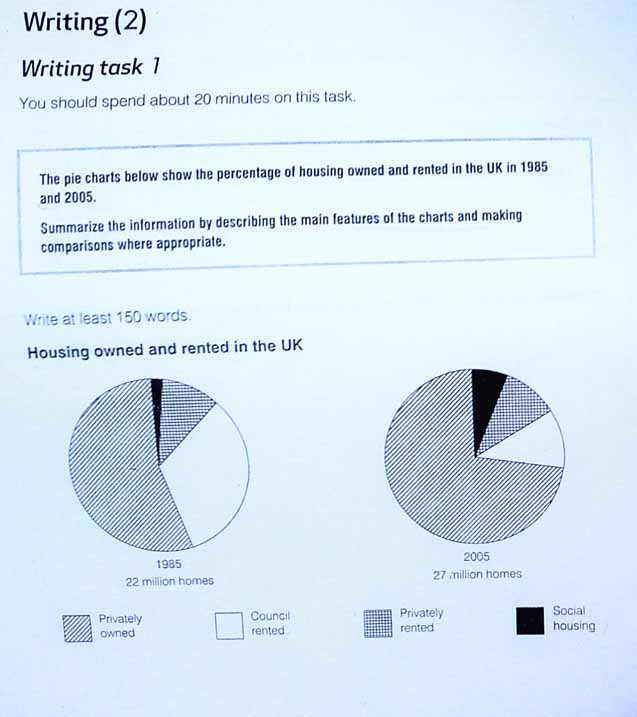
The proportion of private owned housing and rental housing in UK between 1985 and 2005 is illustrated in the pie charts and measured in percentage.
It is clear that while the number of housing owned was a significant increase in a two-decade period which was similar with social housing's trend and broke a record to be the highest position in 2005, the proportion of rental of Council housing went down dramatically in 2005 which was the opposite trend than others. Meanwhile, the number of privately rental house was remained stable in the periods of the question.
In 1985, the number of privately owned stood approximately more than half in the total number and rose sharply of one in ten in 2005. While the number of social housing hovering for a minority number in 1985 and was a slight growth in the last of year, the proportion of privately rented housing was unchanged in the following year and took the same number with the tenancy of Council in 2005. Initially, the number of Council rented housing was in more than in two-fifths in the total number and decrease sharply almost a doubled eventually.

C360_20160813201.jpg
