cinema attendance data
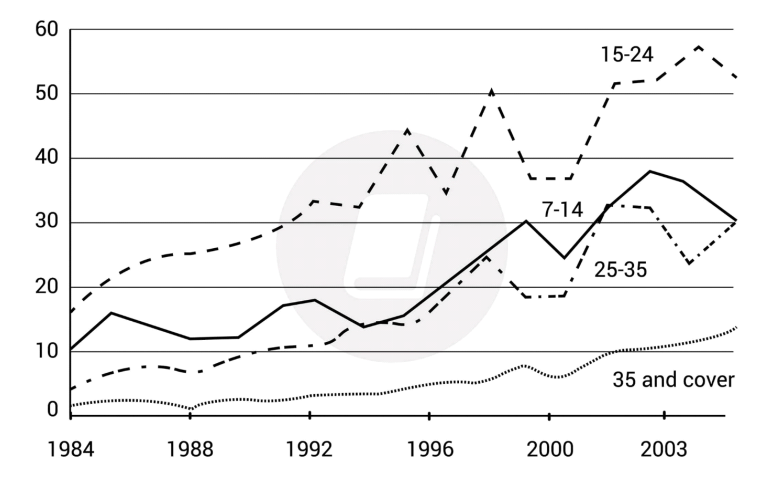
The line graph below illustrates how many people in each age group who watched movie in cinema at least once each month over a period of 19 years starting from 1984
It is clear that the age of 15-24 people had the high frequency of going to theatre and the opposite was true for people who were 35 or over 35 years old . Another noticing thing is that the figures for all age group increased significantly, despite fluctuations
To be more specific , the rank order was 15-24 years old with nearly 20% , 7-14 age group with exactly 10% , 25-35 group and finally 35 and cover group with only around 1% at the beginning respectively. Over this period , this rank order rarely changed but there were a few times when the proportions of 15-24 years old and 7 -14 age group were the same. Over a half of people who aged from 15 -24 in 2003 went cinema at least once a month .
Of the other age group , the figure for oldest group was around 10% more than that of the beginning , while the percentage of both 7-14 years old and 25-35 years old were 30 in the year 2003

9B449123623B4F8AB.png
