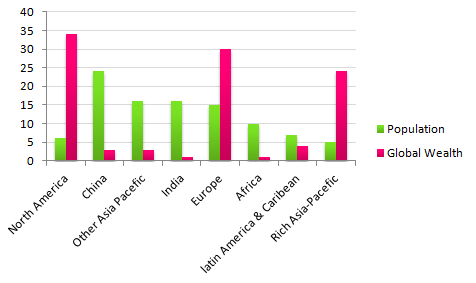
The table chart illustrates the percentage of public community and prosperity in 8 different areas in the worldwide. Overall, it can be seen that there is not correlation between the number of society and the level of wealth whilst Chinese individuals are the first-rank of population and North Americans have the highest number of weal compared with other locations in the world.
Moving to the more detailed analysis, China dominates the global community at nearly a quarter of population followed by Other Asia Pacific and India which are of the same proportion at just over 15 percent in the same category. While 15 percent population in whole wide is European, it decreases a-third in African. Moreover, the total group of Latin American and Caribbean, North American, Rich-Asia Pacific's people are seen a gradual decrease respectively.
In addition, the highest number of wealth is seen by North America at almost 35 percent. Mostly European is more prosperous than Rich-Asian Pacific people while the others only have a small proportion in the same group.

IELTS_Writing_Task_1.png
