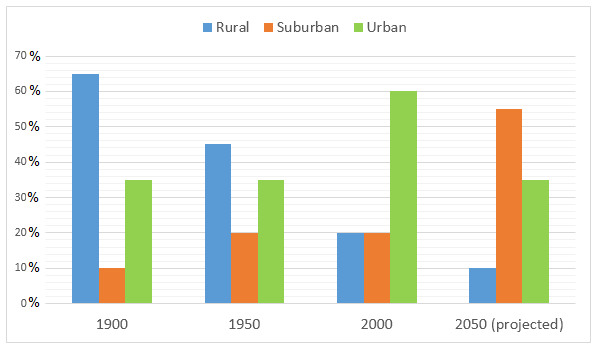
the population distribution in the Northwest Region
Writing has never been my advantage, i appreciate any corrections and advices. Thank you so much.
The graph below shows the figures for population distribution in the Northwest Region for 1900-2050.
The bar chart provides information about the percentage of rural, suburban populations in the Northwest Region between 1990 and 2050.
Overall, the percentage of the village-living populations decreased over the period, meanwhile it is anticipated that a great percentage of people will dwell in city areas in the future.
In 1990, the majority of people lived in rural areas with 65%, compared with only 10% for suburban areas an 35% for urban areas. The following century witnessed a significant decrease in the percentage of rural populations, falling to 20% in 2000. The figure for suburban populations increased gradually and then remained stable at 20%. The proportion of people living in urban areas rose remarkably, hitting its highest point of 60% over the same period.
Looking into the future, the percentage of suburban populations is estimated to experience a sharp growth to 55% in 2050. There will be thirty five out of one hundred people in this region living in urban areas, while only 10% of citizens are predicted to live in rural areas in the same year.

hhhh.png
