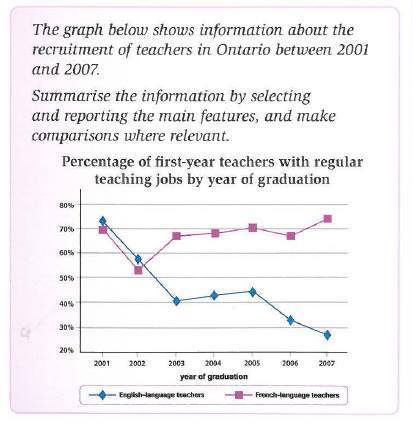
The line graph provides information about selection of English and French teachers in Ontario according to the graduation year from 2001 to 2007, a six-year period and measured in percentage. Overall, it can be seen that a gap between two different teacher's groups had narrowed down in 2001, whereas it showed the large difference in the end of period.
Students who graduated in 2001 and taught English had the similar number with France teachers, at about 70%. Over the next three years, there was a significant drop in the total of English teachers, at approximately a half of the previous proportion. On the other hand,, the first-year French teachers witnessed a fluctuation, at over 50% and below 70% respectively. 2003 to 2005 saw a slight increase, by 3% for both French and English teachers.
In 2007, students who became French teachers reached a peak at 75%, even though the number decreased considerably at over two-thirds in 2006. On the other hand, just a few of the students who were chosen as English teachers in the end of time frame since there was a sharp fall over two years, at 28%.

linegraph.jpg
