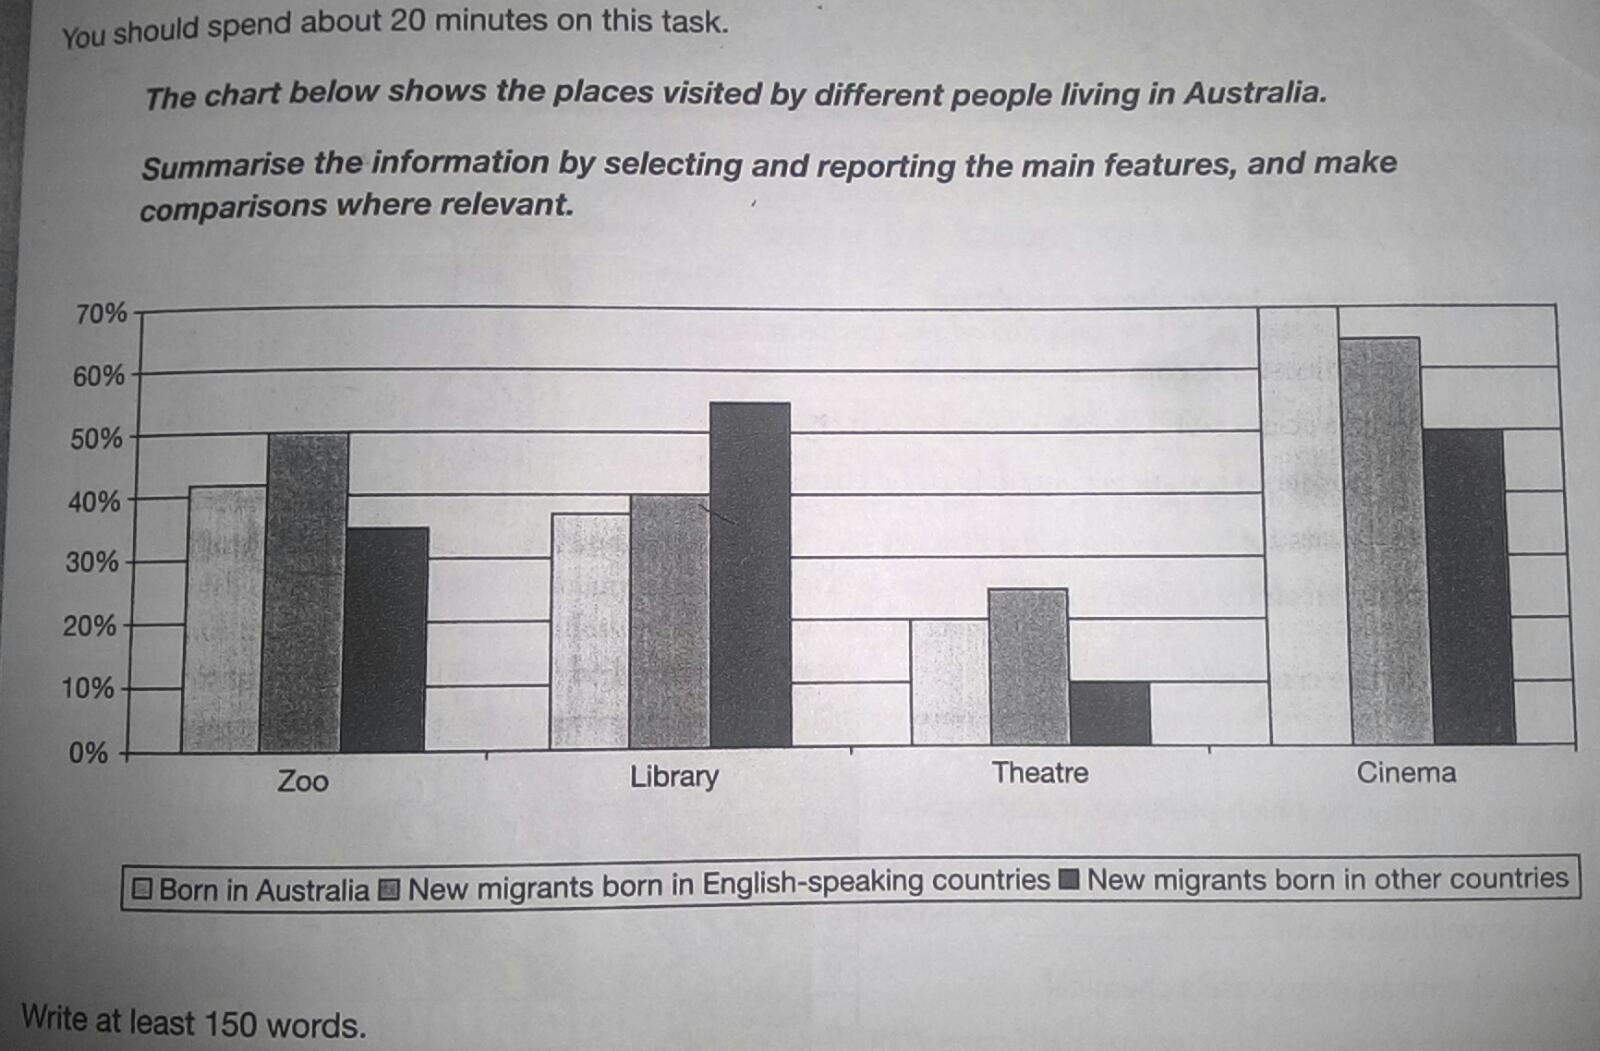
The bar chart shows the percentage of visitors in different places in Australia; they are zoo, library, theatre, and cinema. The measurement of people was separated into three categories. They are Australian nativity, migrants from English mother tongue countries, and the migrants who have birth in non English speaking countries. Overall, it can be seen cinema was the popular destination for the three categories.
To begin, zoo and theatre had same pattern that zoo's rate was twice higher than theatre. Besides, both of them were dominated by the migrants from English speaking countries which peaked at 50% for zoo and 25% for visitors of theatre. This was also followed by the others two ranks.
In addition, the portion of guests in cinema was governed by Australian parentage which imitated by speaking English immigrants. On the other hand, Library was dominated by the immigrants from non English speaking countries with approximately 55% of visitors that it was also followed by the others classes.

IMG20160129WA0004..jpg
