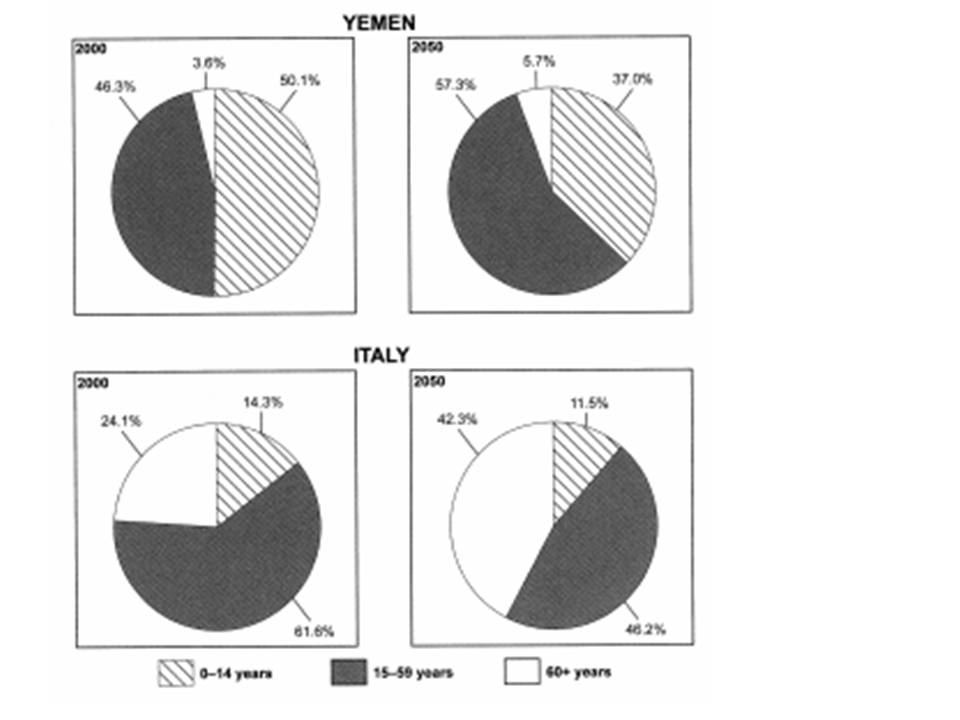
The pie charts given compare the percentage of Yemen and Italy population based on the ages in 2000 and the assessment of it for 2050. The age group was divided into three, e.g. 0-14 years, 15-59 years and 60+ years. Over all, it can be found that both countries was predicted, by 2050, to have decrease in percentage of the largest segment in 2000.
In 2000, the percentage of 0-14 years old people in Yemen was 50,1% as the largest proportion followed by 15-59 years and 60+ years respectively. However, in 2050, this trend is not estimated to be seen again with the decrease of 0-14 years people to 37.0% and the rise of other population percentage, that is 11% for 15-59 and 1.1% for 60+.
In contrast, Italy has assessed to have significant change in percentage of 15-59 years category, from 61.6%, in 2000, to 46.2%, in 2050. The negative change was not only happened for 15-59 years category but also for 0-14 years which is from 14.3% to 11.5%. the one that got increase was 60+ years category that is projected to reach 42.3%.

the graph
