water usage comparison
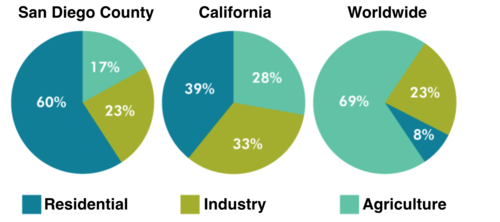
The pie chart below compares water usage in San Diego, California and the rest of the world.
The pie chart compares the amount of water used for resendetial, industrial and agricultural purposes in San Diego, California and the rest of the world.
Overall, in the two American regions, the majority of water consumption for homes and industry, whereas agriculture accounts for most of water used globally.
Looking at the information in more detail, we can see that water usage in households makes up 60% and 39% of the total water consumption in San Diego County and California. However, merely 8% of water consumption worldwide is consumed by homes . The reverse pattern is true for water usage for agriculture. People around the world use the vast majority of water for agriculture, at 69%, while only 17% and 28% of the total water usage in San Diego and California goes to the same purpose.
Both in San Diego and all over the world, 23% of the total amount of water used is for industry, which is 10% lower than the figure for California, at 33%.

6a0120a5bb05d8970c01.png
