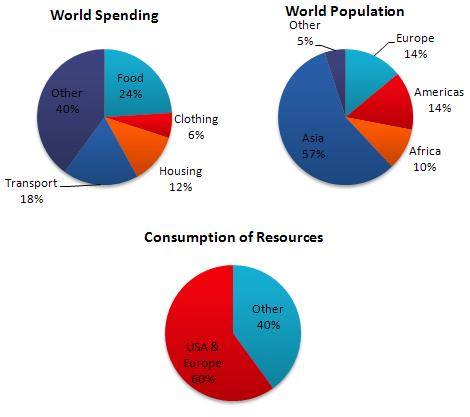
The pie charts below show World Spending, World population and Consumption of Resources
The Pie charts displays the comparison of resources' consumption, expenditures based on primary needs and distribution of population in the world. Overall, it is important to note that most people of the world live in Asia. The greatest proportion of expenditure is used on foods whereas the majority of resources are consumed by USA and Europe people.
Moving to a more detailed analysis, nearly a quarter of the total world spending is made for foods while expense for clothing is just 6%. Afterwards, the expenditures for housing and transports are respectively twofold and threefold of clothing's spending. Subsequently, more than a half of world people settle in Asia, 14% of world population lives in both Europe & America and only 10 % of them inhabits in Africa.
Moving to consumption of resources, USA and Europe representing 28% of global population consume 60% world resources, whilst 72% of world people use just two-fifths of its resource.

pie_chart.jpg
