water used for different purposes
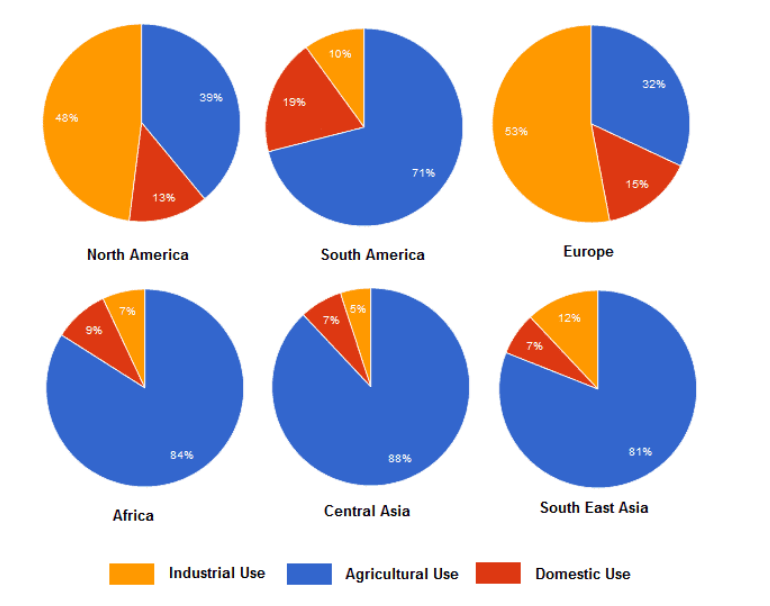
The pie charts compare water usage for industry, agriculture and domestic in six areas of the world, North America, South America, Europe, Africa, Central Asia and South Asia.
It is apparent that agricultural water used accounts for the vast majority in most the countries, except Europe and North America where have the highest proportion of total water usage.
While the water used for agriculture at over 80% in Central Asia, Africa and South-East Asia and accounts for 71% in South America. This figure accounts for almost a third of total water use in North America and Europe. On the other hand, water used for industry in Europe and North America, in turn, accounts for 53% and 48%, higher than five other areas of the world. By contrast, the figures for water consumption only less than 15% in South America, Southeast Asia and Africa. Especially, this amount in Central Asia is the lowest, only 5% of using water.
With the regard to domestic water use, dramatic differences are not seen clearly between Africa and two areas of Asia, where the proportion are at 9% of African water used while both Asian areas account for the same proportion, at 7%. Notably, this figure in North America and Europe are almost twice as high as in Central and Southeast Asia.

Capture.PNG
