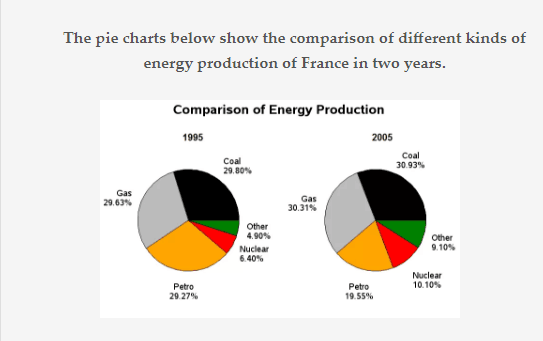
The pie charts below show the comparison of different kinds of energy production of France in two years.
Summarize the information by selecting and reporting the main features and make comparisons where relevant.
The pie charts illustrate five sources of energy production in France. They are categorized as coal, gas, petrol, nuclear and other sources, with the years chosen for the comparative analysis being 1995 and 2005. The essay will summarize the change in the share of energy production from each source and make comparisons where necessary.
Overall, in both years, the primary sources in France were coal and gas, which together made up over half the production of energy, while nuclear and other sources generated the least amount of energy. In almost all types of sources, there was just minimum change over the ten year period. However, the share of petrol underwent a modest drop.
Coal provided 29.80% of energy production in the first year and the share increased to 30.93% ten years latter. Gas accounted for 29.63% and 30.31% of energy production in 1995 and 2005 respectively, placing it the second place behind coal. Petrol retained its position as the third largest source in 2005, though its share of energy production dwindled from 29.27% to 19.55%.
With regard to nuclear, there was an approximate 5% growth in energy production from nuclear. Its share rose from 6.40% to 10.10%. Other sources followed a similar pattern, their share up from 4.90% to 9.10%. Nevertheless, their contributions to energy production in France were still smallest.
I would be more appreciate it if you score my essay.
Summarize the information by selecting and reporting the main features and make comparisons where relevant.
most popular energy sources in France
The pie charts illustrate five sources of energy production in France. They are categorized as coal, gas, petrol, nuclear and other sources, with the years chosen for the comparative analysis being 1995 and 2005. The essay will summarize the change in the share of energy production from each source and make comparisons where necessary.
Overall, in both years, the primary sources in France were coal and gas, which together made up over half the production of energy, while nuclear and other sources generated the least amount of energy. In almost all types of sources, there was just minimum change over the ten year period. However, the share of petrol underwent a modest drop.
Coal provided 29.80% of energy production in the first year and the share increased to 30.93% ten years latter. Gas accounted for 29.63% and 30.31% of energy production in 1995 and 2005 respectively, placing it the second place behind coal. Petrol retained its position as the third largest source in 2005, though its share of energy production dwindled from 29.27% to 19.55%.
With regard to nuclear, there was an approximate 5% growth in energy production from nuclear. Its share rose from 6.40% to 10.10%. Other sources followed a similar pattern, their share up from 4.90% to 9.10%. Nevertheless, their contributions to energy production in France were still smallest.
I would be more appreciate it if you score my essay.

QQez201707211523.png
