survey results
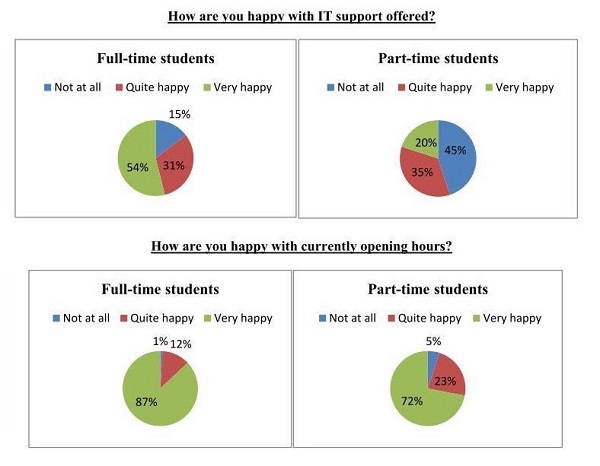
The pie charts execute the results of various opinions of full-time and part-time students on questionaires launched by their university, evaluating how much elation the respondents assess in two categories:current opening hours and offer on IT support.
Generally, there is a common theme that the fascination with opening hours among students delineates the lion's share. Moreover, the distribution of full-time surveyors on optimistic feedback is far greater compared to the lesser satisfaction of their counterparts.
As it is evident from the charts that the majority of full-time students who partake in the survey on the current opening section are very happy. Precisely 87% of them in comparison with nearly three-quarters of their part-time peers. Nevertheless, the proportion of both kinds of participants being melancholic at the service is relatively equivalent. An account of negligible demographics is given to each group: 1% for full-timers and 5% for part-timers. In addition, approximately a quarter of neutral statements are derived from part-time students, whereas only 12% of them are from full-time ones.
Regarding IT support, over half of surveyed full-time respondents reckon this as exceptional ecstasy, while one-fifth of their counterparts experience the same. On the contrary, a significant percentage of part-time students postulating negative feedback is much more extensive than in the field of full-time students, which is 45% and 15%, respectively. The remaining 31% of correspondences from full-time participants reported being quite happy, which is equivalent to 35% of assessments from part-time students.
Could you specifically give a refference band score on this for me please? Thank you very much!

pie1022018.jpg
