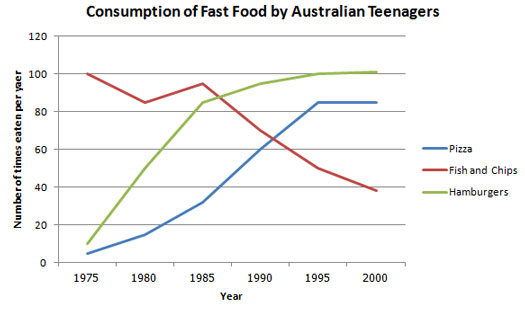
The line graph below shows changes in the amount and type of fast food consumed by Australian teenagers from 1975 to 2000.
Summarize the information by selecting and reporting the main features and make comparisons where relevant.
==================================================================================================
The line graph compares the amount of fast food consumed by teenagers in Australia for three different meals, namely; pizza, fish and chips, and hamburgers between 1957 and 2000.
It is clear that the consumption of fish and chips records as the highest number of eating times per year, while the amount of pizza consumed is the reverse in the first period. However, the consumption of fish and chips declines, although the amount of hamburgers and pizza consumed inclines dramatically over the period.
In 1975, the number of fish and chips consumed was the higher than hamburgers and pizza, at 100 times a year. However, the consumption of hamburgers increased dramatically from just under 20 times a year to 50 times a year between 1975 and 1980, a rise of around 30 times a year. In the year 1985, the number of consumed fish and chips, and hamburgers broke the same record by merely 90 times a year.
A closer look at the data reveals that the consumption of pizza and, fish and chips had the same figure in 1990, at just over 60 times a year. Exceeding, the number of pizza consumed remained reasonably stable by approximately 80 times a year between 1995 and 2000. It finished that the number of hamburgers consumed was in the same level as fish and chips began, with consumption at 100 times a year.

fastfood_australian..jpg
