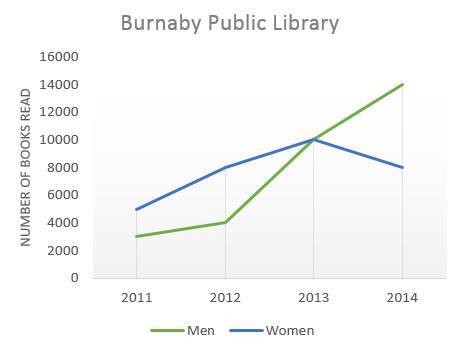
The line chart gives information about a plenty of books which had been read by women and men from 2011 to 2014 at Burnaby Public Library. Overall, despite having an upward trend, both of them showed a different increasing rate.
According to the chart, in 2011, more women read book at Burnaby Public Library with around 5,000 while a slight number at 3,000 was showed in men. This leads to a narrowed gap between them. On the other hand, in 2014 a number of books that has been read by male experienced a considerable increase by 11,000 whereas a less marked increase showed in the figure for female and therefore the gap between them was widened.
A more detailed look at the graph shows that, between 2012 and 2013 female readers increased slightly to 10,000, while a considerable growth showed in males in the same year, causing an intersection. Next, while a marked decrease was seen in female readers, the figure for men increased significantly to 14,000 at the end of the year, successfully overtaking woman figure and reaching its peak.

Line_chart.jpg
