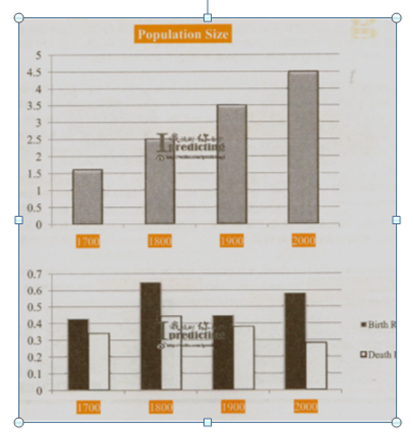
population size in the uk over three centuries
The bar charts indicate the size of the population in a particular region in the UK and the corresponding fertility rates together with mortality rates from 1700 to 2000.
Overall, there was an upward trend in the regional population in the UK on 100 years comparison point commencing from 1700. It is also noteworthy that the birth rates were generally higher than the death rates over the same period.
According to the first graph, in 1700, the population density stood at just above 1.5 million, and gradually increased by equally 1 million every century, reaching a peak of 4.5 million in 2000, which was twice as much as at the start of the period.
In the second graph, the birth rate was initially recorded at above 40%, while the death rate was slightly lower at about 35%. In the following century, the percentages of born and dead people dramatically went up to the highest point at about 65% and 45%, respectively. Both figures saw sudden declines in 1900. Throughout the remaining time, the birth rate experienced a slight recovery to nearly 60%, whereas the death rate declined significantly to the bottom of nearly 30%.
PS: Would you mind evaluate my IELTS essay to see whether my score is around 6.0-6.5? Thank you so much in advance.

Task1_1.png
