Unanswered [2] | Urgent [0]
  

Home / Writing Feedback   % width   Posts: 5


Population of elderly people - IELTS WRITING TASK 1: LINE GRAPH


mrfox9x 1 / -  
Jun 9, 2020   #1

percentage of population aged 65 and above


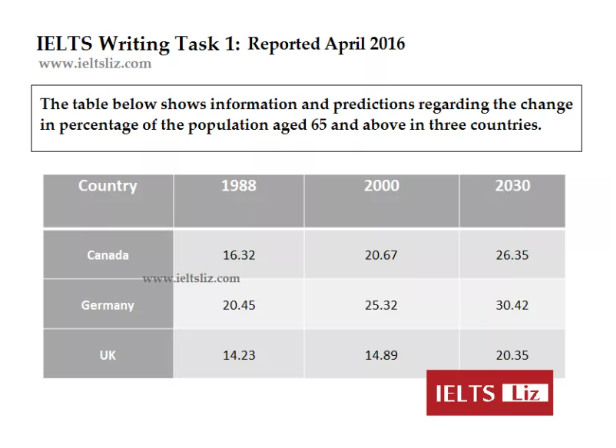
The table illustrates information about the percentage of population who are older than 65 years old in 3 countries in 1988 and 2000, also points out the prediction in 2030.

Overall, the population of elderly people rose from 1988 to 2000 in all 3 countries. In addition, figures for the future is predicted to be higher than the one from the past, and highest percentage over the given period can be seen in Germany.

From 1988 to 2000, the proportions of people who aged 65 and above in Canada and Germany increased by about 5% to 20.67% and 25.32% respectively. On the other hand, there were a relatively little change in the figure for the UK, which remained under 15% in both years.

In the future, it is predicted that the percentage of 65-year-old people and elder one in Canada will reach 26.35% in 2030. There will be also a leap in the figure for the UK, which is expected to rise from 14.89% in 2000 to 20.35% in 2030. Moreover, the highest percentage of people aged 65 and above belonged to Germany, which will remain the leader position in 2030 with a percentage of 30.42%.

  • Untitled.png


athiecheng1010 1 / 1  
Jun 9, 2020   #2
In the third paragraph, where did you get this: "From 1988 to 2000, ... and 25.32% respectively." I was quite confused when looking at this sentense.
vuthuylinh2611 19 / 61  
Jun 10, 2020   #3
I reccomend that you split some of your sentence to make it clearer. For example, your first sentence can be splited into two.

In addition there are some vocabulary and grammar error inyour essay such as "point out the prediction" ->gives prediction ; belonged -> belongs; "remains the leader position" -> maintains
Osama0435 5 / 9  
Jun 10, 2020   #4
@mrfox9x

Hello I'm also preparing my IELTS and I would like to give you some comments as a learner.

1. You could paraphrase the word information with another word data which may help you to have a better introduction.

2. in 1988 and 2000, also points out the prediction in 2030. [in the years 1988, 2000 and a projection in 2030]

3. the percentage of 65-year-old people [the ratio of senior citizens in Canada]

4. There will be also a leap ... [There will be a leap in UK as well]

Good lucks!
Holt  Educational Consultant - / 15347  
Jun 10, 2020   #5
The essay will receive a non-passing GRA score. The overall paragraph presentation is composed of run-on sentences which do not help with the clarity and coherence of the presentation. The sentences are under developed and remain unclear to the reader due to the formatting you have chose to use. Try to state only one idea per sentence. This will help you create a more understandable paragraph. Write up to 5 sentences concerning the presented data in a manner that collates related information in a paragraph.

Before you write the essay, you should decide on how you want to present the information. Since there are 3 countries presented, you should be presenting the information in the following manner:

Par. 1: Summary overview
Par. 2: Comparison of oldest and newest information
Par. 3: Mid range comparison for all 3 countries

Using the above example would have helped you present the data in a more relatable and understandable manner. It shows how you analyzed the information rather than just stating the information as you did in the above essay. The format I suggested always results in a better score overall.


Home / Writing Feedback / Population of elderly people - IELTS WRITING TASK 1: LINE GRAPH
Do You Need
Academic Writing
or Editing Help?
Need professional help with your assignments? Fill out one of these forms:

Graduate Writing / Editing:
GraduateWriter form ◳

Best Essay Service:
CustomPapers form ◳

Excellence in Editing:
Rose Editing ◳

AI-Paper Rewriting:
Robot Rewrite ◳