Writing task 1: population change Line graph
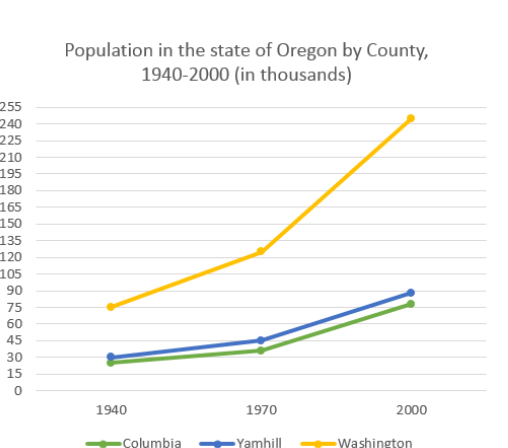
The graph below shows the population change between 1940 and 2000 in three different counties in the U.S. state of Oregon.
The graph demonstrates the population in terms of three different counties in the U.S. state of Oregon over a period of 60 years, from 1940 to 2000.
Overall, It is noticeable that three counties' population in the U.S. state of Oregon experienced a considerable increase throughout the period shown.
In 1940, The Columbia county's population and The Yamhill county's population stood at nearly 25 thousands and 30 thousands respectively. While, The Washington county's population occupied the highest figure, at 75 thousands. Over the following 30 years, The Columbia county's population and The Yamhill county's population increased sharply to nearly 35 thousands and 45 thousands respectively. While, The Washington county's population increased significantly to nearly 125 thousands.
By 2000, The Columbia county's population and The Yamhill county's population had increased magnificently to 75 thousands and 90 thousands respectively. Whereas, The Washington county's population had increased considerably to nearly 243 thousands.

Screenshot324.png
