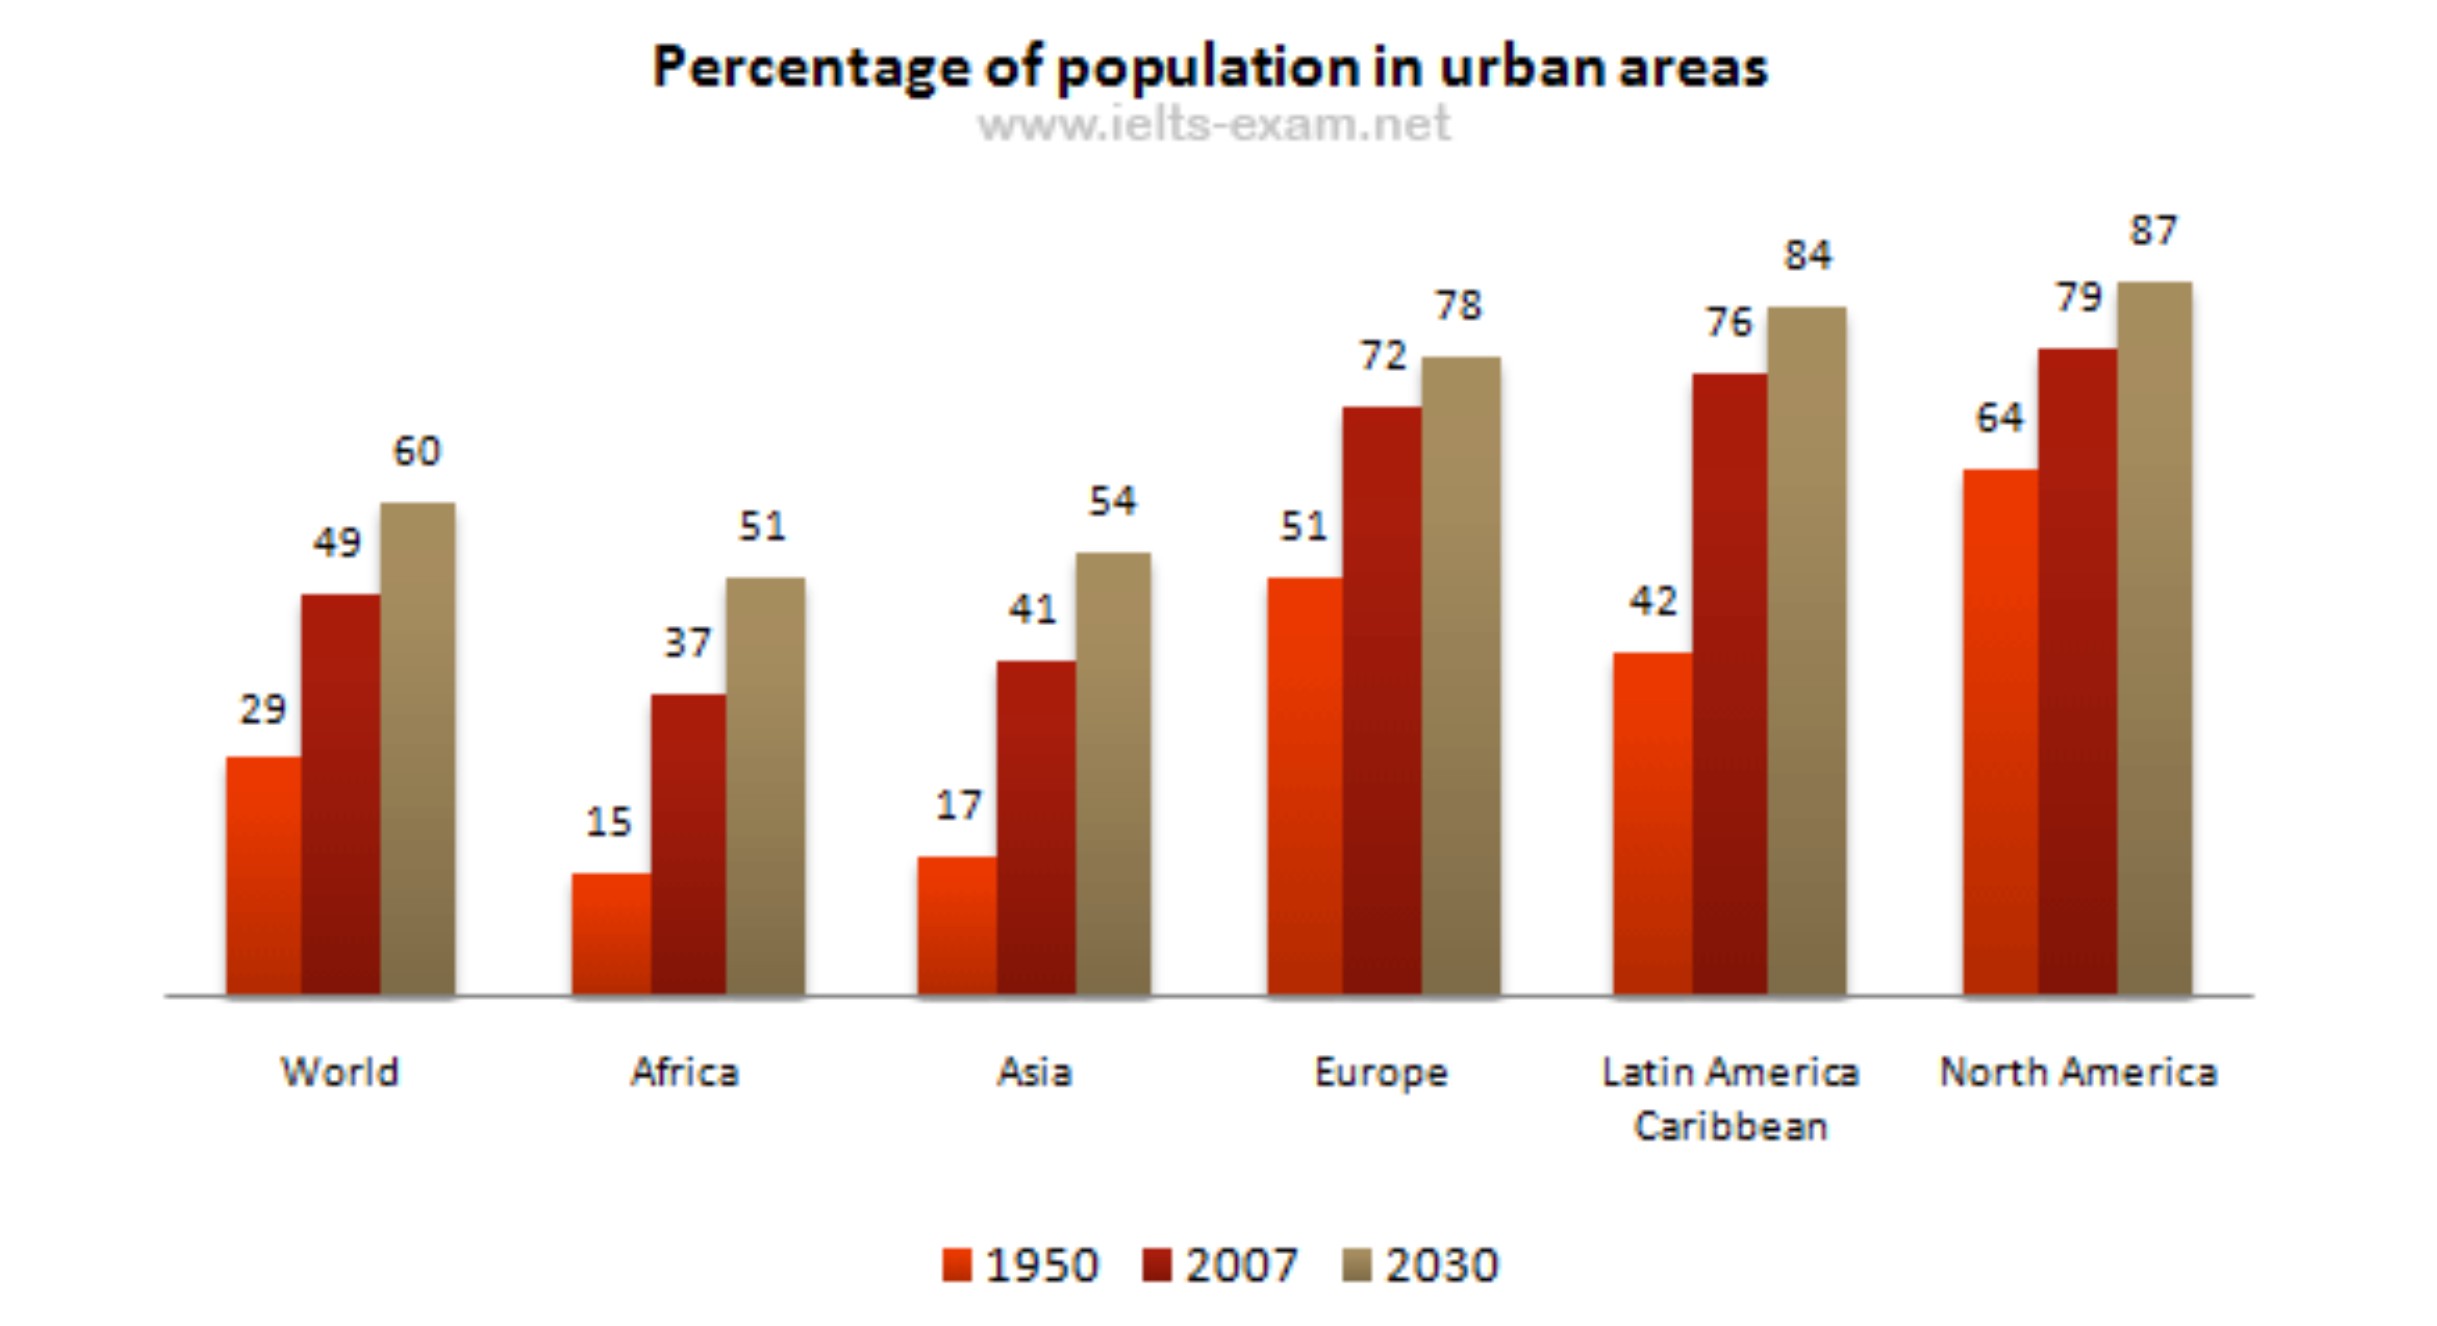
The bar chart illustrates the percentage of inhabitants who live in cities around the world and in all continents except Australia over eight decades. Overall, it can be seen that world and all continents showed in chart had upward trend and it is estimated that this trend will continue until 2030. In any case, developed continents have higher percentage than developing continents.
North America had the largest percentage during the period and also had a slight rise by 15% from 1950 to 2007. Europe percentage was the second largest in 1950, but it became the third in 2007 due to Latin America Caribbean which had only 42% population in the first year experienced a significant increase by 34% in 2007.
1950 to 2007 saw a large increase in the percentage of urban areas' population of Africa and Asia by 22% and 24% respectively. The estimated rises of these two continents in 2030 were 13% and 14%, around twice more than those of developing continents. Meanwhile, the number of world's citizen rose by 20% in 2007 and is estimated that will rise again to 60%.

Graphic2.jpg
