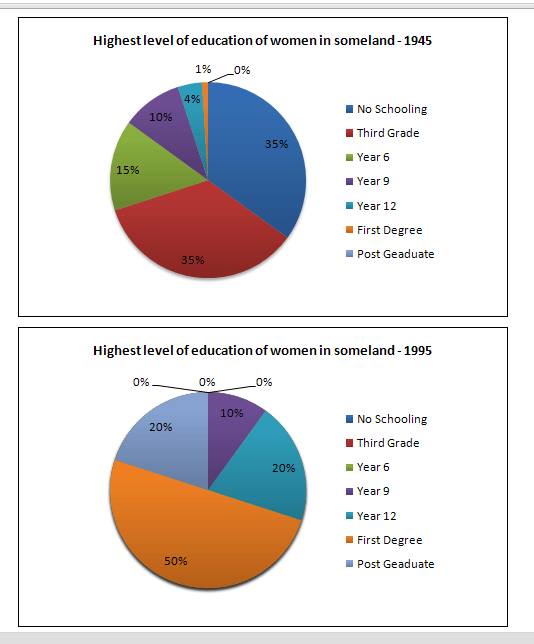
The pie chart displays the ratio of highest level of education of women in someland in 1945 and 1995. Overall, it is obviously seen that there was a significant transition among the proportion of highest level of education shared in 1955 compared to in 50 years earlier, especially in the most dominant one.
By 1995, the percentage of women who attended to university level dominated the whole proportion with 50%, a highly considerable upturn of 49% compared to 1945 with only 1%. Meanwhile, in 1945, the domination of the whole percentage was fairly shared between no schooling and third grade levels with 35% each. Surprisingly, those levels of education along with 6 years education dropped drastically to hit a low of 0% in 1995.
A gradual rise also happened in post graduate level that came up with the figure at 20% in 1995 while it had 0% in 1945. And so did the level of 12 years education that rose from 4%-20% during that half century period. However, the only level that the proportion remained stable in both years (1945 and 1955) was 9 years education with 10%.
(190 words)

13151743_10204576017.jpg
