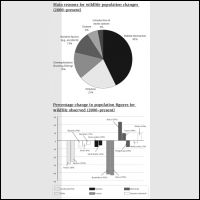
The breakdown of the figure for predominant reasons for wildlife population alteration is presented in the pie chart between 2000 and present days, whilst the table chart illustrate the level of alteration in population figures for wildlife in the same period. It is important to notice that the highest proportion have been seen in habitat destruction's level. While, the percentages of most wildlife population have increased extremely, the converse has appeared to be true for several categories of animals' populations.
Turning to the pie chart, there is a large proportion for habitat destruction, roughly four out of ten, while pollution's level is a half as much. This has followed by over-exploitation, 15 %. In any case, the rest of proportions' level has shown very small proportion.
When it comes to table chart, the most noticeable changes have been seen in the proportion of insects, when butterflies and bees have declined markedly, 42 % and 43 % respectively. The percentage of freshwater fish has narrowed a gap to the highest one by approximately a ten while other population's level that have same trend only have seen very small proportion. Interestingly, several animals' population in categories of mammals and aquatic mammals have upward trend, almost a quarter for bats while others roughly a half as much.

267555_1_o.jpg
