goods transported in the UK
The graph below shows the quantities of goods transported in the UK between 1974 and 2002 by four different modes of transport. Summarise the information by selecting and reporting the main features, and make comparisons where relevant.
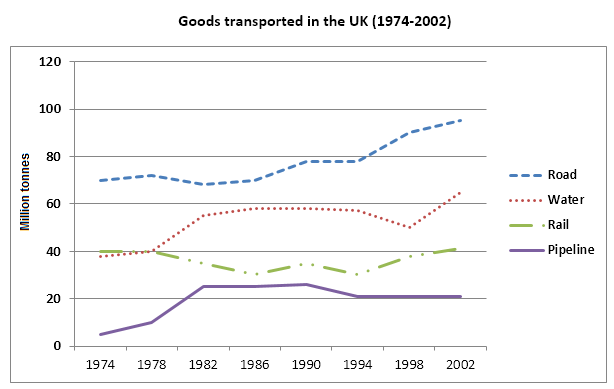
The presented graph compares four types of transport in terms of the amount of goods transported by each type in the United Kingdome from 1974 to 2002. Overall, it is clear that the most quantity of goods was transported by roads, while the lowest one was transported by pipelines.
The number of goods transported by water and rail was nearly 40 million tonnes from 1974 to 1978. After that, the figures for goods transported by mail registered a fluctuation until it reached almost 41 million tonnes in 2002. However, the count of goods transported by water had increased to almost 55 million tonnes in 1981. Later, it remained almost constant until 1998, when it decreased slightly before reaching its peak at 65 million tonnes in 2002.
Merchandise transferred by road accounted for the highest number all over the given period. Since the number was 70 million tonnes in 1974, then it showed some slight fluctuations until it almost reached 90 million tonnes in 2002. Conversely, merchandise that was moved by pipeline continued to have the lowest number with almost 1 million tonnes in 1974. After that, it showed an impressive increase as it reached nearly 22 million tonnes in 1995 and remained stable with this figure until 2002.

goodstransportedin.png
