Task 1 - The percentage change in the number of Canada's international students
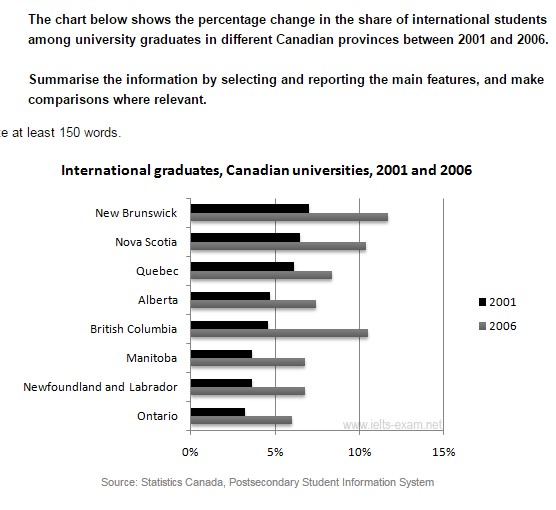
The bar chart reveals the proportion alter in the rate of overseas university students in several regions in Canada over following a five-year period from 2001 to 2006. Overall, although most province occurred a rise in the total of international academic pupils, Alberta's zone instead experienced in decreasing number 5 year later.
Based on the data, the total of graduates in several countries had similar pattern exception the figure for international graduates in Alberta and British Columbia. There were three areas where saw a dominant percentage over 10% in 2006, namely New Brunswick, Nova Scotia and British Columbia. Yet, in the beginning of year, meanwhile they witnessed a slight number approximately 7 per cent besides the number of British Columbia's students dropped sharply to 5 per cent. Interestingly, it was the same proportion as Alberta's number in 2006.
A more detailed analysis look at the graph reveals that other provinces such Manitoba, Ontario, Newfoundland and Labrador had similar ways which in 2001, they solely stood at under 4% and increased above 6%.

international_studen.jpg
