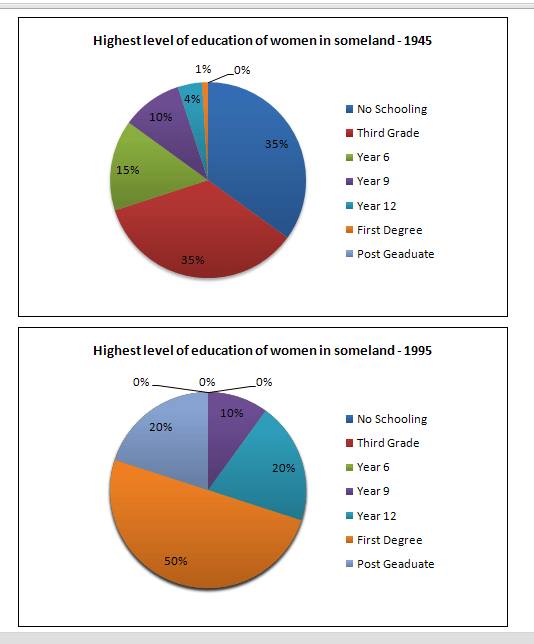
The pie charts compare the proportion of education level completed by women in several regions in 1945 and 1995, a half century period. Overall, while a significant rise saw by women who schooled at the first degree level, those who were not educated and finished until the third grade saw a downward trend.
Initially, the percentage of women schooled at the first degree was fairly low, at only 1%. However, the figure increased dramatically over fifty years to represent the largest proportion at 50%, predominated over the seven groups. The proportion for both the year 12 and postgraduate were the minority in 1945, just under 5% and suddenly increase to a fifth, approximately a 20%-rise in five decades.
There was a significant decrease for either the percentage of women no schooling and the third grade, from 35% then suddenly decreased to represent zero in 1995, dissapear from the whole proportion. The percentage for those completed the year 6 experienced a 15%-decrease. The change was seen constant in the remaining groups, at one in ten throughout the period.

13151743_10204576017.jpg
