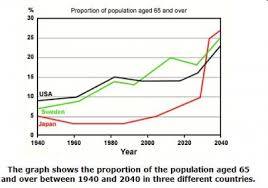
A breakdown of the information about community of aging people in a 100-year period in several countries is illustrated in the line chart. Overall, all of figures showed an upward trend. Although, Japan people had the lowest number over 90-year but, in the end of period, they were by far most dominant in the total of population.
Initially, by early year, the widened gap have been seen between USA and Japan graph. After twenty years, the proportion of USA and Sweden experienced significantly increase at 7% and 9% respectively while the slightly decreased in Japan at the same year at 3%. In addition, by 1990, Sweden surprisingly overtook the place from USA at 15%.
Turning to the last fifty years, in 1990, Japan got the first position from others countries with sharply rose at 27% and succesfully reached a peak in the end of year. Nevertheless, both of USA and Sweden experienced significantly increase 25% and 23% respectively.

population.jpg
