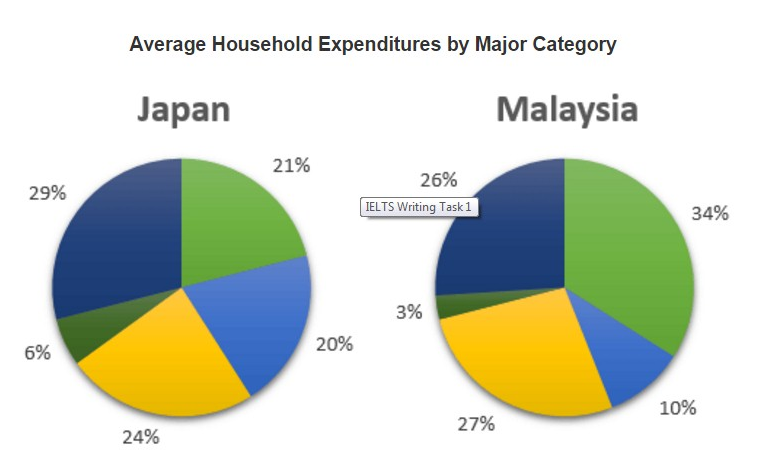
The pie chart reveal that the proportion of average expenses of household in two different countries in 2010. Overall, it could be seen that both Malaysia and Japan had similar pattern which were food, housing and also other goods and services were three main expenses. In any case, in both countries, the smallest percentage of expenditures was on health care.
In Japan, the largest number of Japanese' expenditures was to pay other goods and services in 29 percent. It was 3% as much as the percentage of Malaysia' other goods and services and it was followed of spending money to buy some foods at 24%. However, buying housing become the least of expenditure.
According to the pie chart, in Malaysia the highest rate of expenditure was on housing at 34%, whereas housing of Japan accounted for 21%. Similar with Japan, the spending of food came in second place in Malaysia at 27%, it was higher 2% than Japan. By contrast ,the smallest percentage of household spend was buying housing.

task_2_2.png
