Unanswered [1]
  

Home / Writing Feedback   % width   Posts: 3


The proportion of people who had a habit of eating five portions of fruit and vegetables every day


Thao Vy Tran Thi 1 / -  
Jan 30, 2021   #1

the percentage of people who ate five portions of fruit and vegetables per day


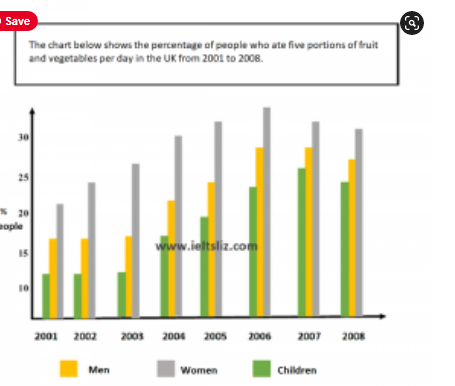
The bar graph illustrates the proportion of people who had a habit of eating five portions of fruit and vegetables every day in the United Kingdom between 2001 and 2008. On the whole, English women consumed the largest amount of fresh fruit and vegetables, followed by men as the second. Having eaten the smallest amount of fruit and vegetables, children accounted for the smallest percentage throughout the whole period.

In England, the figure for women rose gradually from about 21% in 2001 to approximately 30% in 2005 before reaching a peak at 34% in 2006. From this point, there was a slight drop by just under five percent in the next two years.

In terms of men and children eating five portions of fruits and vegetable, the two categories had a tendency to remain unchanged in the first three years of the period, then grow gradually from 2004 to 2007 before experiencing a slight fall at the end of the period. 2006 and 2007 was the year that men consumed the largest amount of fruit and vegetables at a rate of roughly 28%, whilst for children it was just in 2007 with the peak at 25%. As was the case for men, the proportion of children eating fruit and vegetables was lowest in 2001, 2002 and 2003.

  • Capture44.PNG


Holt  Educational Consultant - / 15461  
Jan 31, 2021   #2
Your first paragraph depicted an accurate summary of the information from the image. You also properly identified the graph that was used in the presentation. This is one of the better summary overviews I have read so far at this forum. However, the presentation that you used in the summary overview did not carry over in accuracy and clarity in the next paragraphs.

Though you used the correct 3 paragraph presentation for this report, you created run on sentences in both the remaining paragraphs. This made it difficult to follow the accuracy of your data presentation for the remainder of the data listing. In the second paragraph, you need to have done at least another sentence analysis to have helped in the presentation of accurate information and a proper comparison of the given data.

In the last paragraph, you relied solely on commas to separate your presentations. There is a lack of punctuation usage in this particular paragraph to show that you can clearly present information using various sentence formations (simple and complex). An over reliance on the use of a comma results in run-on sentence presentations which tend to blur the information presented as you try to compress 2 separate information presentations into one sentence. The analysis in this section was a bit confusing to follow as you were constantly presenting information for the men and children within the same sentence. These should have been separated in paragraph form. In fact, you could have used the presentation for the men in the second paragraph, to use as a comparison with the women, rather than the children. A comparison between adults is more logical as the data presentation would be somewhat similar or uniform as compared to adult v. kids information comparisons.
LadyOfClockwork 30 / 100  
Feb 8, 2021   #3
Hello, I am not sure that women consume more vegetables and fruit than men. What I learn from the charts is that "in percentage terms, there are more women who eat that much of fruit and vegetable than men, who in turn exceed children"


Home / Writing Feedback / The proportion of people who had a habit of eating five portions of fruit and vegetables every day
ⓘ Need Writing or Editing Help?
Fill out one of these forms for professional help:

Best Writing Service:
CustomPapers form ◳

Graduate Writing / Editing:
GraduateWriter form ◳

Excellence in Editing:
Rose Editing ◳

AI-Paper Rewriting:
Robot Rewrite ◳