Unanswered [5] | Urgent [0]
  

Home / Writing Feedback   % width   Posts: 3


The proportion of people who used the Internet in three countries between 1999 and 2009


khadong 1 / -  
Feb 6, 2021   #1

WRITING IELTS TASK 1: THE PERCENTAGE OF INTERNET USERS


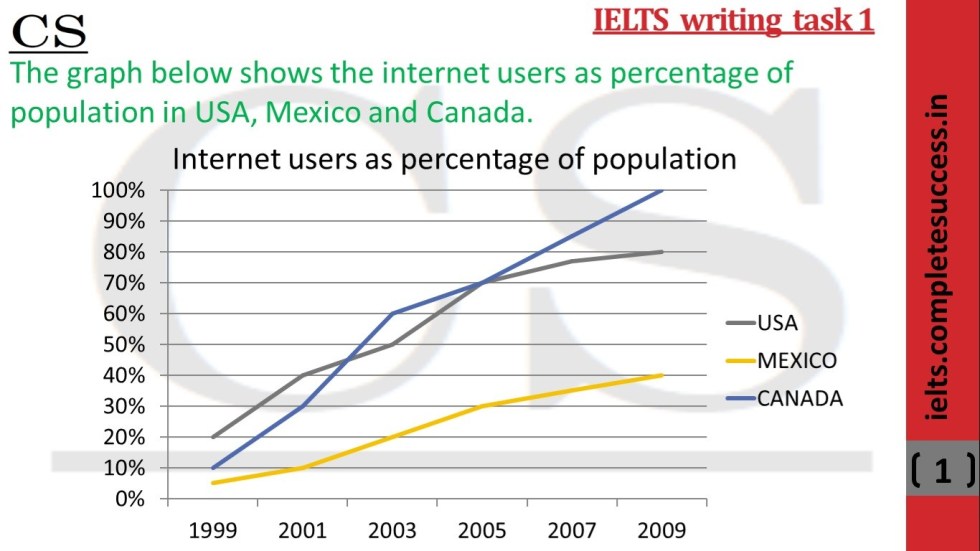
The graph compares the proportion of people who used the Internet in three countries between 1999 and 2009.
Overall, all three countries experienced upward trends over the period shown. Additionally, Internet usage in America and Canada was considerably higher compared to the figure for Mexico throughout the 10 years from 1999.

A more detailed look at the graph reveals that in 1999, the percentage of Americans having access to the Internet was 20 percent, which was higher than the figure for Canada (10 percent) and for Mexico ( 5 percent). In 2005, both the statistics for America and Canada stood at approximately 70 percent whereas only 25 percent of Mexico's population used the Internet. From that time on, the proportion of Internet users in the USA and in Mexico rose steadily, with the former reaching just below 80 percent and the latter amounted to about 40 percent of the total population. Meanwhile, the figure for Canada saw a sharp increase, reaching almost 100 percent.

To summarize, there was considerable growth in the percentage of people who used the Internet in America and Canada. Internet usage in Mexico also rised but the alternation was less marked.

I hope you will read my writings and correct the mistakes that I've made. Thank you very much in advance.

  • ieltstask1.jpg


Holt  Educational Consultant - / 15393  
Feb 7, 2021   #2
There is a big difference between the task 1 and task 2 essay writing requirements. The task 1 essay does not require a summary or concluding paragraph. It only requires 3 paragraphs that informs the reader about the data from the image provided. This is unlike the task 2 essay that requires a summary of the previous discussion points. That also means, that the writer should only provide one trending statement in the presentation. There is no need for an "additional" trending statement in the summary overview. There is no need to summarize the essay with another trending statement either. Just integrate those information into the next 2 data reporting paragraphs and your presentation will be more prompt adherent and task accurate.

You did a good job in the second paragraph. You showed a varied sentence and information presentation that remained true to the presentation and summarized the information to help create a concise, but coherent paragraph. However, you should have tried to divide the analysis a bit more to meet the minimum 3 paragraph requirement. That means, creating an additional analysis paragraph at the end rather than the summary paragraph. From what I see in the graph, there were 2 comparison points you could have used. These are the intersection portions of the graph where the line meet at an equal point. These happened in 2002 and, I believe, 2005. Such a paragraph presentation would have resulted in a truly analytical presentation that considered all of the data requirements from the instruction prompt.
Linhmely 1 / 2  
Feb 9, 2021   #3
i think you should go for this structure with the introduction, the overview and the 2 detailed paragraphs


Home / Writing Feedback / The proportion of people who used the Internet in three countries between 1999 and 2009
Need Writing or Editing Help?
Fill out one of these forms:

Graduate Writing / Editing:
GraduateWriter form ◳

Best Essay Service:
CustomPapers form ◳

Excellence in Editing:
Rose Editing ◳

AI-Paper Rewriting:
Robot Rewrite ◳

Academic AI Writer:
Custom AI Writer ◳