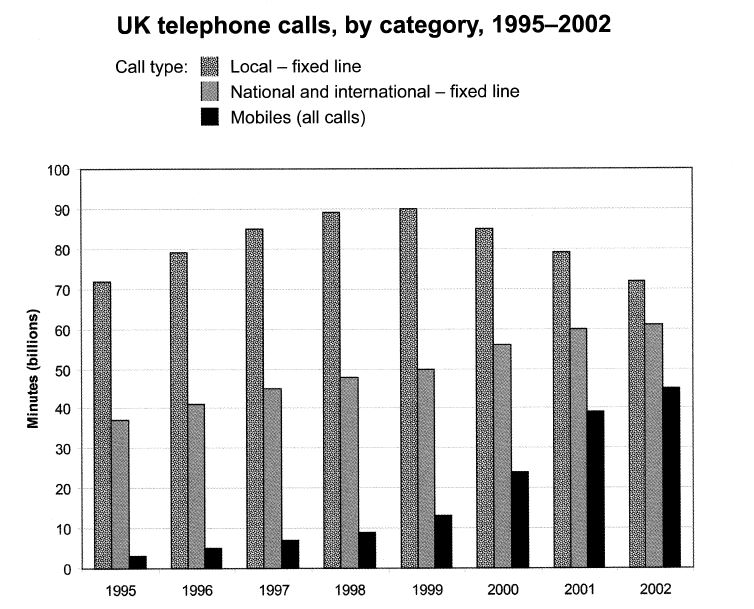
The chart below shows the total number of minutes (in billion minutes) of telephone calls in the UK, divided into three categories, from 1995-2002. Summarise the information by selecting and reporting the main features, and make comparisons where relevant.
Given is bar chart describing the proportion of 3 kind of telephone calls (in billions minutes) by british dwellers for 7 years. It is noticeable that while the local communication rates went down, a growth of call was witnessed by national and international and mobile communication.
Having the biggest proportion of calls throughout periods, local calls stood at around 70 billion minutes in 1995, experiencing a slight increase for 5 years later. Uniquely, in 1999, british inhabitants spent 90 billion minutes for this call, reaching the peak among periods. However, this fell to near 70 billion minutes in the end of period.
On the other hand, national and international and mobiles connection increased every year. They began at approximately 40 billion minutes and less than 5 billion minutes respectively. A steady growth is recorded by national and international calls, accounting around 60 billion minutes in 2002. Conversely, a similar trend is followed by mobile calls until 1999, then surprisingly, this rocketed at around 45 billion minutes, twice greater compared with the initial period, this category, however, remained as the lowest number of call among other categories.
Phone calls time in minutes in UK
Given is bar chart describing the proportion of 3 kind of telephone calls (in billions minutes) by british dwellers for 7 years. It is noticeable that while the local communication rates went down, a growth of call was witnessed by national and international and mobile communication.
Having the biggest proportion of calls throughout periods, local calls stood at around 70 billion minutes in 1995, experiencing a slight increase for 5 years later. Uniquely, in 1999, british inhabitants spent 90 billion minutes for this call, reaching the peak among periods. However, this fell to near 70 billion minutes in the end of period.
On the other hand, national and international and mobiles connection increased every year. They began at approximately 40 billion minutes and less than 5 billion minutes respectively. A steady growth is recorded by national and international calls, accounting around 60 billion minutes in 2002. Conversely, a similar trend is followed by mobile calls until 1999, then surprisingly, this rocketed at around 45 billion minutes, twice greater compared with the initial period, this category, however, remained as the lowest number of call among other categories.

task1_bar_chart.JPG
