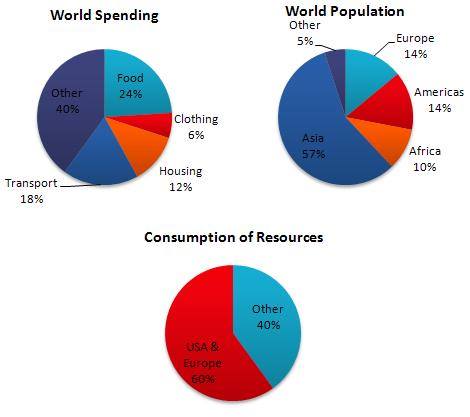
The pie charts below show World Spending, World population and Consumption of Resources.
The bar charts bellow illustrate proportion of world expense, amount of world population and utilisation of sources in the four countinent and are calculated by percentage. Overall, it is important to notice, The percentage of asia people is the highest compared the others. On the other hand, the people who live in USA & Europe show dominant in consumtion of sources.
Move to detail, with total population at 28%, people in America and europe utilize resouces at 60% higher than people live in the other continent containt of asia, africa, and the other continent at 72% but consume source just 40%. It mean in america and europe double of twist compared with total in habitan in asia, africa, and the other continent.
Turning to world spending, eventhough food have percentage at 24% but it is till lower campared other expenditure taht have at 40%. Whilst transpot expenditure is in the third position wit percentage at 18%. The lowest world spending is cloting with at 60% .

6884_102060526733017.jpg
