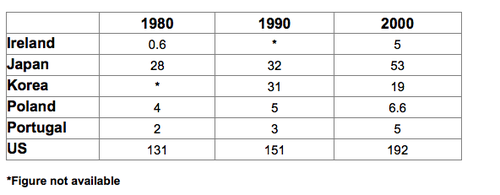
The amount of waste production in 6 countries
The table below shows the amount of waste production (in millions of tonnes) in six different countries over a twenty-year period.
The table compares the quantity of waste generation in millions of tonnes in six nations during the period of twenty years from 1980 to 2000.
Overall, the United States produced the largest amount of waste over the period. Also, while waste output in most given countries witnessed an upward trend, Korean's amount of waste production decreased.
With respect to the waste output in America, it grew from 131 in 1800 to 192 million tonnes in 2000, which was a relatively huge amount compared to other nations. In the same year, Japan, the second largest waste producer, generated 53 million tonnes of waste, accounted for one-third that of the US. Meanwhile, Korea's waste output experienced a drop of 12 from 31 in 1990 to 19 million tonnes in 2000.
Compared with the previously mentioned nations, Ireland, Poland and Portugal generated small amounts of unwanted material. Ireland and Portugal has the same quantity of waste production in 2000, at 5 million tonnes, while Poland saw a minimal growth of 2.6 million tonnes in its waste output throughout the time span.

f.png
