water use and water consumption coverage
The graph and table below give information about water use worldwide and water consumption in two different countries.
Summarise the information by selecting and reporting the main features, and make comparison where relevant.
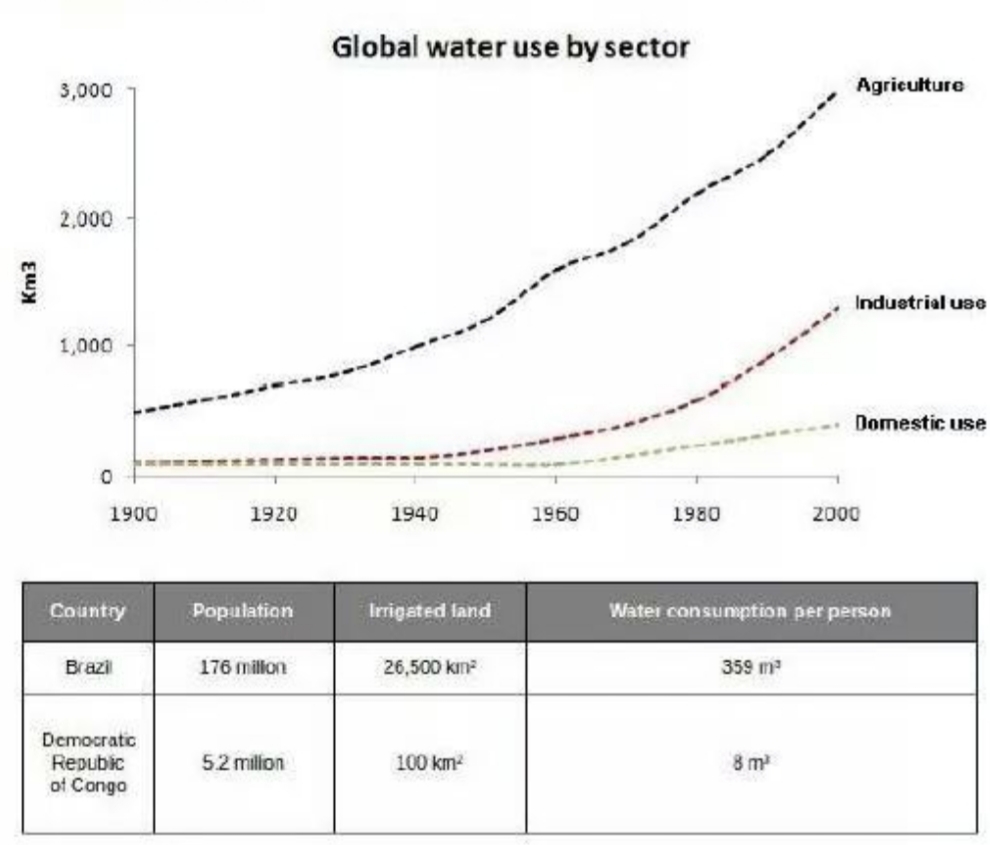
There are one line graph and one table. The former illustrates the quantity of water usage by different ways in the world while the latter depicts the water consumption in Brazil and Congo in the year of 2000.
Overall, it is exceedingly evident that agriculture water usage accounted for a great deal of amount in 2000. Meanwhile, water consumption for each citizen in Brazil was for than in Congo in the same year.
Taking a closer look at each graph and table, it is crystal clear that agriculture water usage was gradually increased from 1990 to 1950 and rose dramatically from 1950 to 2000 and reached 3000km3 in the year of 2000. On the contrary, industrial and domestic water usage remained stable from 1900 to 1940. From 1950 they both increased slightly while the industrial water usage rose higher than domestic one until 2000.
As can be seen on the table, Brazil had 176 million population, which was 35 times more than Congo. Compared to both countries' water consumption for each citizen, it is no doubt that Brazil required more water than Congo due to the fact that tremendous irrigated land and population.

20191113_183915.jpg
