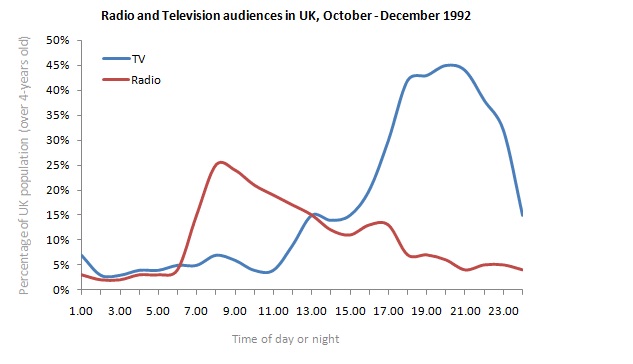
The graph shows radio and television audience through the day in October to December 1992. Percentage of audience in UK population over four years old.
The graph shows two lines the first line shows percentage of TV audience in UK. The second line shows percentage of radio audience in UK over four years old.
Firstly, TV audience from 1.00 to 2.00 decreased slightly about 5% audience. From 2.00 to 7.00 leveling off 5% audiences. In four hours from 7.00 to 11.00 increase slightly about 1% audience but at 8.00 increased about 5% audience. From 11.00 to 21.00 rose sharply about 45% audience. Then, from 21.00 to 23.00 decline sharply about 15% audiences.
Secondly, radio audience from 1.00 to 6.00 leveling off under 5% audience. From 6.00 to 8.00 increased sharply 25% audience. From 8.00 to 23.00 decrease sharply about 5% audiences.
Overall, TV audience increase sharply from 11.00 to 21.00 before radio audience increase sharply from 6.00 to 8.00.

radio_and_tv_audiens.jpg
