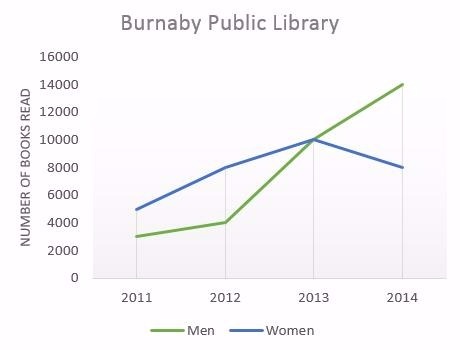
The line graph illustrates the rate of books read at Burnaby Public Library in a period of four year between 2011 and 2014, based on both sexes. It is noticeable that the number of book read by men increased over the period while women had a sharp fall in 2013 after reaching a peak.
To begin, women read the books in Burnaby Public Library stood at around 4,200. Subsequently there was a steady rise by roughly 2000 books read in 2013, after hit at 8000 in 2012. The number then declined to about 7,800 books in the end of period.
In contrast, the number of books read by men just around 3,000 in beginning. Afterwards, it experienced a steady grew in one year to 4,000 then increased dramatically by 6,000 books in 2013. In this point, female readers at Burnaby Public Library overtook by men. Whereas the number of books read by women witnessed a slight fall, the rate of books read by men growth considerably to 14,000.

AsZqDr5ap5SjcP2BB2.jpg
