Hi guys, I'm new here, I wish to improve my IELTS writing skills, please kindly share your feedback and suggestions by this essay to produce a good milestone ahead. Thanks again, cheers !!
Here the question:
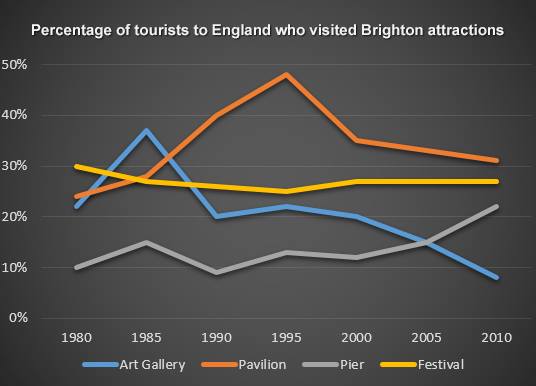
The line graph below shows the percentage of tourists to England who visited four different attractions in Brighton
My answer:
The graph presents the ratio of holidaymaker who visit Brighton attractions in England consists of four different common places: Art Gallery, Pavilion, Pier and Festival between 1980 and 2010, a 30 - year period. Overall, more people went to Pavilion as the most visited among the three remaining places, while the figure of Art Gallery showed reverse.
A further observation between 1980 and 1995 informed tourists who visit Pavilion increased significantly about 50 % in 1995. During the same period, Art Gallery climbed down the percentage after reach a 38 % in 1985 to 22 % in 1995. Similarly, Festival spot also occurred a slight decrease of 25 % in 1995 while the figure of Pier spot fluctuated between 10 % and 15 %.
In next future years by 2010, the percentage of Pavilion started to gradual decline from 50 % in 1995 to 31 % in 2010 as well as Art Gallery dropped the ratio into 8 % in corresponding period. However, the figure for Pier ended significantly toward important improvement of 22 % in 2010 and also there was no significant improvement by the figure of Festival ratio over the period as a whole.

13177275_10204576007.jpg
