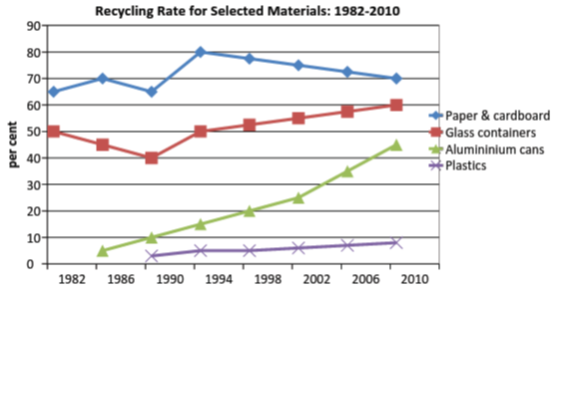
The graph below shows the proportion of four different materials that were recycled from 1982 to 2010 in a particular country.
Summarise the information by selecting and reporting the main features, and make comparisons where relevant.
The given chart depicts the information of recycling rate of four materials in a country from 1982 until 2010, in percentage.
Overall, all the materials undergo rises from 1982 to 2010. Meanwhile paper & cardboard and glass containers change fluctuated, the proportion of cans and plastics always grow every year.
Recycling rate of paper & cardboard and glass containers increased 5% and 10% perspectively. In 1984, paper & cardboard rised around 5% then fell again in 1990 at the same number in the first year (65%). 3 years later, this material stood at highest level (80%) compared to other materials as well as its position in other years. At the end, it peaked at 70%. Glass container, on the other hand, started the position at 50%, in 1990 this material declined 10%, then increased into 60% in 2010.
on the one hand, aluminium cans and plastics climb until the last. Aluminium cans had huge percentage of increase, aroun 40%. Meanwhile plastics grew slowly every year, from 2% at first until 9% at last.
Please give me comments,feed backs, and band score if possible. :)
Summarise the information by selecting and reporting the main features, and make comparisons where relevant.
recycling rate of four different materials
The given chart depicts the information of recycling rate of four materials in a country from 1982 until 2010, in percentage.
Overall, all the materials undergo rises from 1982 to 2010. Meanwhile paper & cardboard and glass containers change fluctuated, the proportion of cans and plastics always grow every year.
Recycling rate of paper & cardboard and glass containers increased 5% and 10% perspectively. In 1984, paper & cardboard rised around 5% then fell again in 1990 at the same number in the first year (65%). 3 years later, this material stood at highest level (80%) compared to other materials as well as its position in other years. At the end, it peaked at 70%. Glass container, on the other hand, started the position at 50%, in 1990 this material declined 10%, then increased into 60% in 2010.
on the one hand, aluminium cans and plastics climb until the last. Aluminium cans had huge percentage of increase, aroun 40%. Meanwhile plastics grew slowly every year, from 2% at first until 9% at last.
Please give me comments,feed backs, and band score if possible. :)

recycling_data.png
