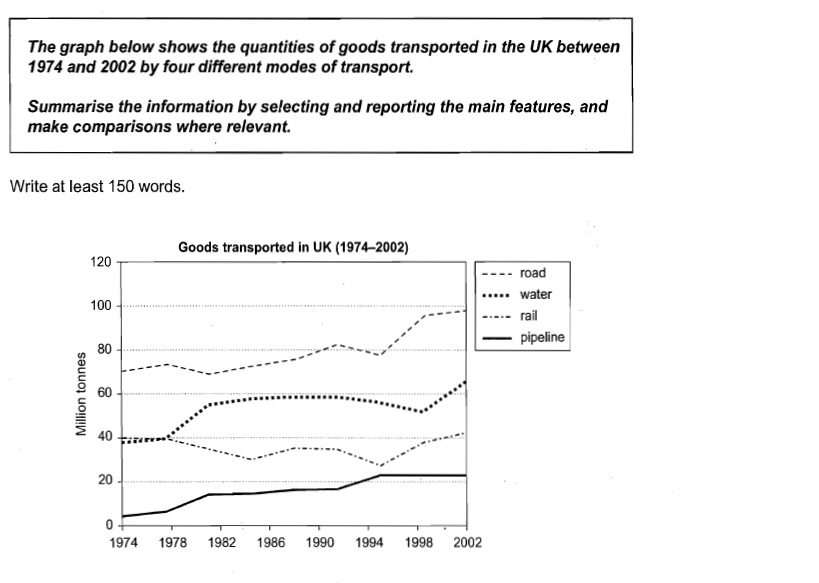
The graph presents a trend about the amount of consumer products transported in the UK in the period between 1974 and 2002 through four various methods of transport, including road, water, rail and pipeline. At first glance, most of the goods are transported by road.
Most of goods were transported by trucks. It accounted for 70 million tonnes in 1974 and had been gradually increasing to 80 million in 1996, followed by a sharp rise between 1996 and 1999. it reached 100 million tonnes in 2002.
Water and rail transportation had a similar trend at the beginning period. It remain steady until goods imported by ship climbed to nearly 60 million tonnes in 1978 and dropped to 50 million tonnes in 1998 before rapidly rising to 65 million at the end of period. On the contrary, rail transportation declined from 40 million to 30 million in 1984. It then increased a bit but dropped to the bottom of below 30 million in 1995. However, it restored to around 40 million tonnes in 2001.
Pipeline transportation remained the least over the period, it started from 5 million tonnes and continuously climbed to over 20 million tonnes in 1995. The quantities of goods remained steady over the rest of the period.
Overall, road was the most common transportation which is about 5 times as much as pipeline.

Untitled.jpg
