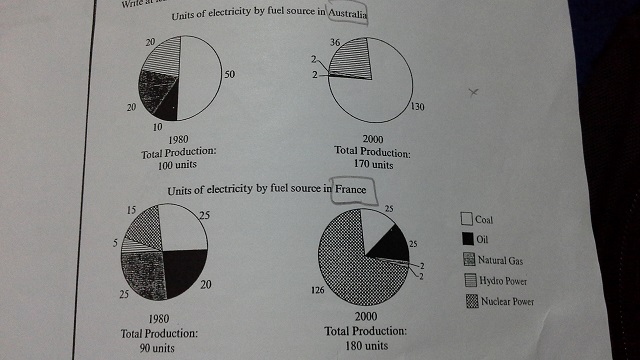
The pie charts below show units of electricity production by fuel source in Australia and France in 1980 and 2000.
Summarize the information by selecting and reporting the main features, and make comparisons where relevant.
The pie charts illustrate abour the unit of electricity production by fuel source in Australia and France in 19980 and 2000. At first glance, it is evident that coal is the biggest total production than other units in Australia, while in France, nuclear power is the biggest production units over the year.
To begin with, in 1980, the total production of electricity by fuel in Australia is 100 units with qualification coal (50 units), oil (10 units), natural gs (20 units), and hydro power (20 units), except nuclear power.
...

20150424_184015.jpg
