Hi guys. This is the first report that bases on statistics. I find it so hard when I begin to write this. May I have not been familiar with this analyzing topic. Please help me broaden my poor idea. Thank you very much. :D
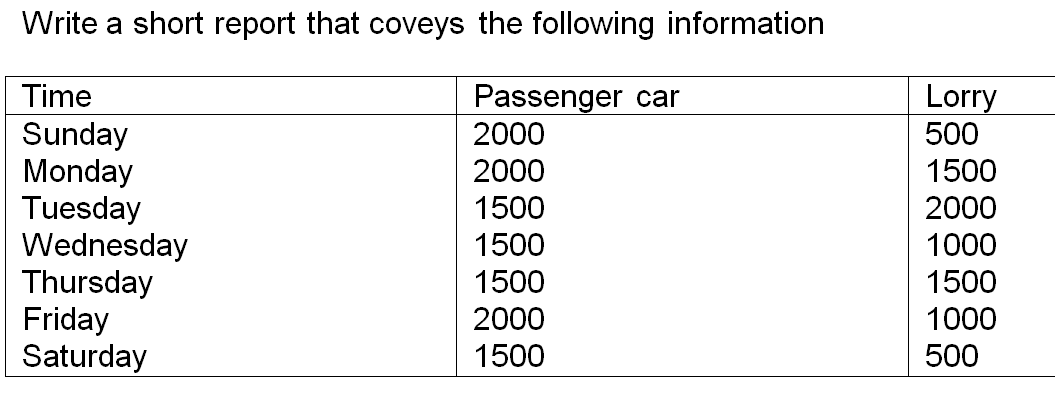
Write a short report that coveys the following information.
The table shows the number of the passenger cars and Lorries traversing the Waterloo Bridge at each day, from Sunday to Saturday, of a week. The highest number of passenger cars going over the Bridge is 2000 at Sunday, Monday and Friday. Whereas, that of Lorries is 2000 only at Tuesday. Thursday is the time which has the equal number of 2 kinds of vehicle. The best notice is the unusual up-and-down number of lorries. They only have 500 at Sunday and Saturday, 1000 at Wednesday and Friday. For passenger cars, they still maintain at 1500 at the remainder of a week. One more thing that needs to be observed is the total of number of Passenger cars and Lorries. They are always equitable or lower 3000 each day.

Untitled.png
