The chart and table below show customers satisfaction levels in the US with airlines and aspects of air travel in 1999, 2000 and 2007.
Summarise the information by selecting and reporting the main features, and make comparisons where relevant.
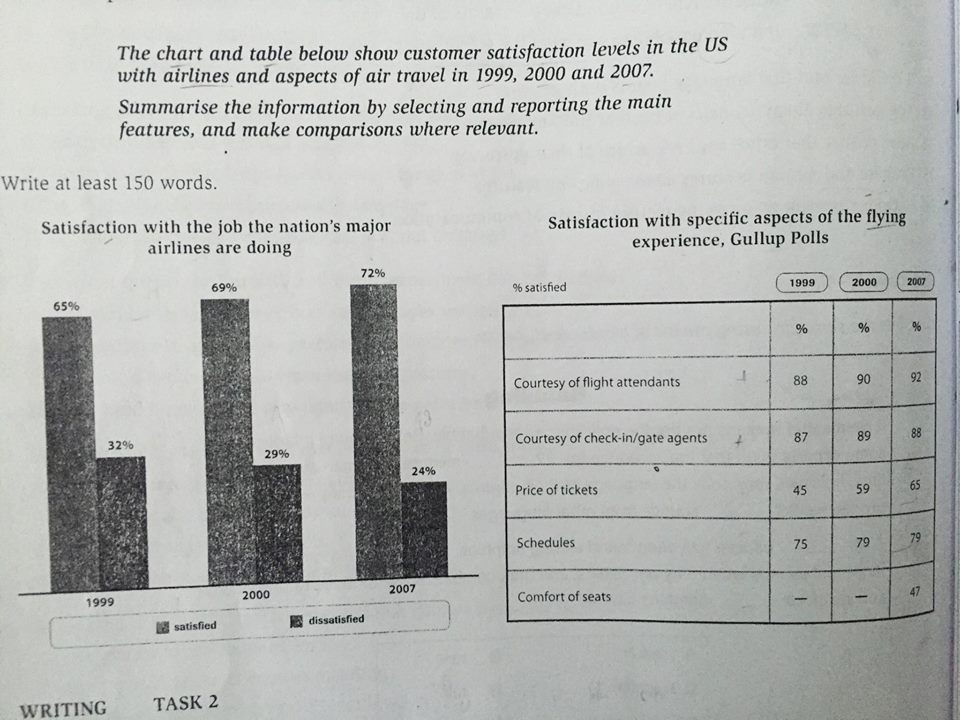
The vertical bar chart presents how satisfied the customer traveling by national airplanes in the United States and the table gives information about several detailed aspects in Gullup Polls from 1999 to 2007. Overall, it can be seen that, while those who are satisfied with the service experienced an upward trend during the period, the figure for dissatisfied saw the reverse. It is also noticeable that the greatest proportion was in the courtesy of flight attendants.
In 1999, 65 percent of customers satisfied with the airlines agency. The number rose gradually to 69 percent one year later and peaked at 72 percent in 2007. On the other hand, the dissatisfied category witnessed a slight decrease, from 32 percent to 24 percent, in such years, a 8-percent decline in 8 years.
Between 1999 and 2007, there was a noticeable service in courtesy of flight attendants, around 88-92 percent. The second was experienced by courtesy of gate agents, an increase of 1 percent 8 years later. However, there was a gradual rise in satisfaction of ticket prices and schedules, a rise by 20 percent and 4 percent respectively. Unfortunately, the latest category in 2007 only saw 47 percent.

Satisfactions_Levels.jpg
